News
CA120: California’s 2016 Hillary vote
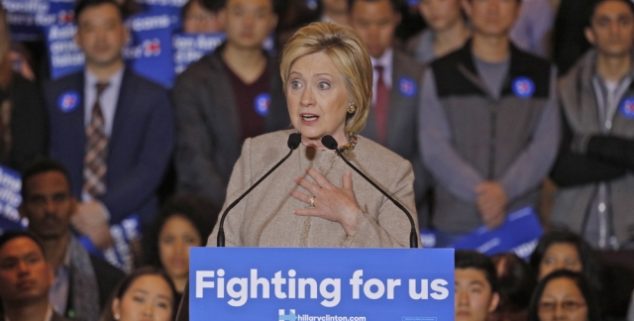 Hillary Clinton at a January 2016 rally in San Gabriel. (Photo: Joseph Sohm)
Part 3 of a three-part series examining California’s 2016 presidential vote.
Throughout the 2016 election cycle, Capitol Weekly conducted several polls of California voters. Two surveys — one during the primary election and the other during the general — targeted voters immediately after they mailed in their ballots.
More than 80,000 people responded to the surveys.
Now, more than a year since we began, we went back and asked those same respondents how they feel about the candidates they backed, about the issues that they deemed important and about their view of the political climate since the 2016 elections.
Fully three-quarters of her supporters from 2016 do not believe that she should run again.
We also asked them whether they would like to see their preferred 2016 candidate run again in 2020.
In the third part of this three-part series, we look at Hillary Clinton voters from the June 2016 primary and November general elections. Our earlier stories examined the voting for Donald Trump and Bernie Sanders. (To see the Sanders results, click here, and to see the Trump results, click here)
Our latest survey, which can be seen in a fully-interactive infographic, polled voters who supported Hillary Clinton. This includes 876 from the primary election and 1,300 from the general.
In this study, we look not only at her level of current support among her 2016 voters, but we also sought to determine how these respondents view the aftermath of the 2016 elections, and how they assess the direction of the Democratic Party now that a Republican is in the White House.
Some of the immediate findings:
–Clinton voters have not changed their positions about how they voted in 2016. Some 95% of her primary election voters and 97% of her general election voters say they voted for Clinton. In contrast, some 20% of the Sanders voters from last year’s primary election said in our latest survey that they did not vote for him.
–This consistency in stating that they supported Clinton should not be confused with a desire for her to run again. Fully three-quarters of her supporters from 2016 do not believe that she should run again. This is in contrast to 40% of Sanders supporters who think he should run in 2020.
–There is support for Clinton’s post-campaign public statements and how she has continued to work on issues. Among her voters, 56% approve and 15% disapprove of her work since leaving government and the campaign trail. Among Democratic primary voters, this increases to 63% approve and 11% disapprove.
–Clinton backers give the Congressional leadership a strong 58% approval rating, with 29% disapproving. This is significantly higher than the rating from Sanders voters, who put it at 46% approve, 41% disapprove. The Clinton calculation also includes Republicans who voted for her in the primary. Focusing on Democrats, her backers give their party leadership in Congress a 62% to 27% approve/disapprove rating.
–Democrats who backed Clinton in the primary and general elections report a strong interest in the 2018 contests: Eighty-seven percent say they are very motivated to vote. This is in contrast to 79% of Republicans and 75% of Independents.
–Looking back at issues that some claim cost Clinton the election, 42% believe she ignored working class issues and 46% say she should have supported single-payer healthcare. However, while Sanders backers overwhelmingly blamed a rigged party system, 65% of Clinton backers disagreed with this.
The difference between the two camps can be viewed more as an issue of velocity, rather than direction.
–While Sanders supporters strongly believed that he would have won the general election, Clinton backers don’t believe this to be true, with 62% saying that Sanders would not have won. And while only 11% of Sanders backers blame him, in part, for Clinton’s loss, that number grows to 39% among Clinton voters – but it is far from a majority who hold this position.
–While the media seems to be making a lot of the post-election break between Hillary and Bernie voters, this polling also illuminates a connection between these voters on policy. In each of the questions regarding the direction of the Democratic Party, Clinton and Sanders voters agree. Sanders voters are slightly more aggressive, wanting the party to do more on progressive issues. But for the most part, there is a working majority among backers of both candidates. In this way, the difference between the two camps can be viewed more as an issue of velocity, rather than direction.
–Using the online infographic, Capitol Weekly readers can go in and select different sets of voters – separating the Democrats from the Independent voters who were able to cast ballots in the open Democratic primary, or clicking on the Republican voters who backed Clinton. Readers can also focus in on the voters who believed the email scandal was a legitimate issue, and see how that segment of the electorate responded to all the other questions.
—
Ed’s Note: Paul Mitchell is vice president of Political Data and the founder of the CA120 column. Political pollster Jonathan Brown is the president of Sextant Strategies. Both are regular contributors to Capitol Weekly.
Want to see more stories like this? Sign up for The Roundup, the free daily newsletter about California politics from the editors of Capitol Weekly. Stay up to date on the news you need to know.
Sign up below, then look for a confirmation email in your inbox.
Leave a Reply