Analysis
CA120: Say hello to the California Voter File
 Voters and potential voters at a political rally. (Photo: Joseph Sohm, via Shutterstock)
The California Voter File is a massive and constantly changing dataset. At the end of the 2012 election cycle, it grew to more than 18 million voters. But with recent purges from county election files, it has dropped to its current 17 million.
As we near a major statewide election, we expect to see an uptick in registration and growth of the overall voter file. The state’s registration is likely — again — to exceed 18 million, and potentially even reach 19 million by November.
This is entirely predictable.
The size of the California electorate has followed the same pattern for decades: After each presidential election, with nothing stimulating voter registration, numbers drop as voters move or die and are purged from the rolls. Modest growth comes with the subsequent gubernatorial general election, then registration dips before the presidential primary.
Finally, with the excitement of another presidential general election, registration rebounds, consistently reaching new heights 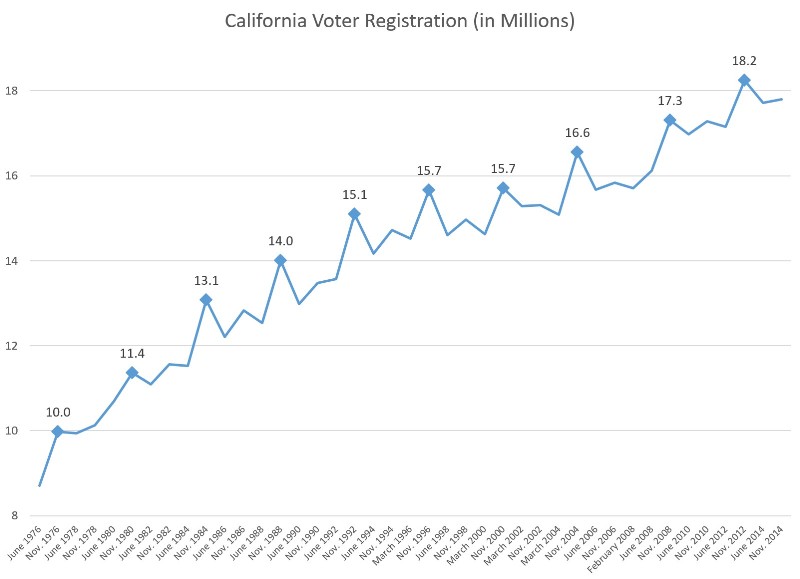
As we watch this year’s presidential primaries, we have seen many stories in the media about growth in voter registration, lines at the polls and overflowing caucuses.
Yet, in California, pre-primary voter totals have not traditionally spiked. The last time that California registration actually grew in the nine-months prior to a presidential primary was in June of 1980. There is often a lot of re-registration, but not enough new registrations to make up for the regular cleanup of the voter file.
Even so, we may have to adjust our expectations and quickly plan for a potentially changing electorate.
Looking more closely at the 2012 and 2014 late registrations, and including the 2012 primary, we can see how differently these voters behaved.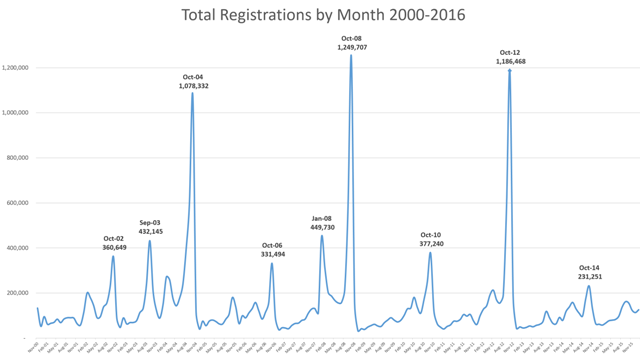
An unexpected wave of pre-primary new registrants would raise many questions. There are stories of new voters in other states causing a wave of support for populist candidates, upsetting the establishment and creating some down-ballot impacts for other candidates on the same ballot. But, if there was a wave of registration, does that mean that these new voters will actually vote come Election Day, and will their interest be limited to one presidential contest, or will they heavily influence congressional, legislative, and even local elections?
The last big surge of voter registration came in the summer and fall of 2012 when the enthusiasm for the national election — and the implementation of the online registration system — combined for nearly 1.5 million registrations in the month prior to the general election registration deadline.
And, of these 1.5 million voters, more than 1.2 million actually turned out on Election Day, accounting for a massive 82% turnout for a population whose median age was just 29 years old.
Looking just at this 2012 bubble, one could jump to the conclusion that new registrants are high-propensity voters. But anyone making that assumption would have been very disappointed in 2014, when only 42% of new registrants cast ballots, or in the 2012 primary, when new registrants dipped into the mid-20% range.
Looking more closely at the 2012 and 2o14 late registrations, and including the 2012 primary, we can see how differently these voters behaved. And, not only are there differences between voters from each election cycle, we can also see very strong differences between voters who are re-registrants with prior voting history, and new registrants who are on the voter rolls for the first time.
The 2012 general election had 72% turnout that was bolstered by the large number of new registrants who turned out at upwards of 80%. And as can be seen in the chart below, turnout for re-registrants was 5-to-10 points higher than turnout for new first-time registrants.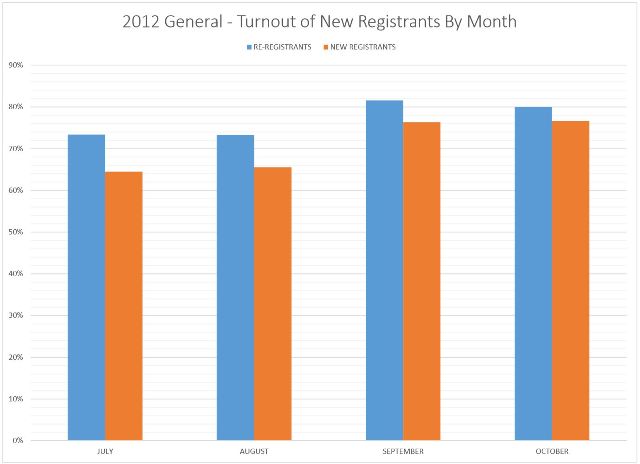
In the 2012 primary election, turnout was significantly lower, with just 31% of registered voters casting ballots. And this is reflected in the turnout by re-registrants at 31% and new registrants under-performing at just 18% of average.
The lowest rates of expected turnout for the upcoming primary are the voters who were part of the 2012 surge in registration.
The rate of participation does grow as it gets closer to the election, but definitely we have a trend in the primary election where new registrants were not a high-turnout population. If anything, they were less likely to vote, despite having registered immediately prior to the election.
An argument could be made that registrants before a low-enthusiasm election are more “process” registrations, like those registered at the DMV or at a registration booth, rather than the so-called “surge” registrants who are excited voters registering specifically to participate in the upcoming election.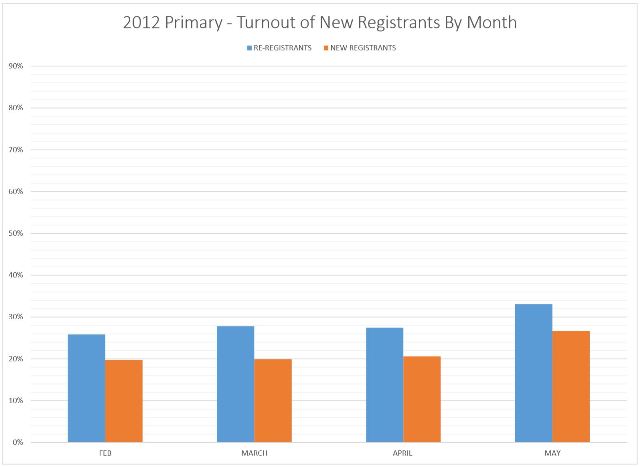
The 2014 general election had a historically low November turnout of just 42%. Re-registrations mirrored the total turnout, but was lower for those who registered 3-to-4 months prior to the election. There was only a slightly higher turnout for re-registrants 1-to-2 months out and for those who were new registrants in the last month.
As these charts show, the turnout rates for new registrants can fluctuate based on the election cycle. Voters who register or re-register in the months leading up to the election could largely be surge registrants excited about an immediately upcoming election, or they could be the same process registrations we see year-round.
This difference in the time during which someone registers, and whether they are a re-registrant or a new registrant, are only a couple of key factors.
Additionally, some voter registration is done through active voter registration drives, while others are done at the DMV or other state offices, or, increasingly, registrations are done online. And, for each of these methods we can identify trends.

To get a sense of how this breaks down, below is a table showing registration prior to 2012, those registered during the 2012 surge, and those registered in the years since, split by their method of registration.
Total Voters by Registration Time and Type
| TOTAL | REGISTERED BEFORE 2012 | REGISTERED
2012 |
REGISTERED
2013-2016 |
||||
| TOTAL | 17,167,654 | 11,390,548 | 2,301,236 | 3,474,310 | |||
| Motor Voter | 2,592,787 | 1,450,144 | 13% | 242,124 | 11% | 899,792 | 26% |
|
Online
|
1,243,183 | – | 0% | 538,540 | 23% | 704,552 | 20% |
| Paper Registration | 13,331,946 | 9,939,944 | 87% | 1,521,187 | 66% | 1,870,073 | 54% |
While how a voter registers does not seem likely to be a strong indicator of participation in an upcoming election, we can look at each of these sets of voters based on who is a likely voter in the 2016 Primary Election, and some interesting trends develop.
Likely Voters by Registration Time and Type
| TOTAL | REGISTERED BEFORE 2012 | REGISTERED
2012 |
REGISTERED
2013-2016 |
||||
| TOTAL | 6,239,570 | 4,826,503 | 482,513 | 930,118 | |||
| Motor Voter | 665,431 | 433,612 | 30% | 46,257 | 19% | 185,378 | 21% |
|
Online
|
311,217 | 71,283 | 13% | 239,703 | 34% | ||
| Paper Registration | 5,262,979 | 4,392,735 | 44% | 364,981 | 24% | 505,056 | 27% |
The most likely voters based on time of registration are older registrants, currently pegged at an average of 42% likely, but with a wide discrepancy between DMV and traditional paper registrations. This is because DMV registrants historically have shown a much lower turnout, something that will likely weigh upon advocates for the new expansion of the DMV registration law.
The lowest rates of expected turnout for the upcoming primary are the voters who were part of the 2012 surge in registration. These voters, mobilized by the nationalized election, have developed a trend of only voting in presidential general elections. This trend was spotted in 2012 when, among voters under 26 years old who voted in the November 2012 and 2008 Generals, only 27% had voted in any intervening statewide or local elections.
This leads to one of the most shocking findings within the data. Those 2012 surge registrants who participated at 80% or higher are now only projected to turn out in the 2016 Primary at 13% based on their voting behavior since the 2012 cycle.
What will we see in 2016? That’s the main question for campaigns right now. We are clearly witnessing a nationalized election with surging voter participation in other states, but we have yet to see how this will develop in California.
We will be doing a deeper dive in the 2016 numbers after the 60-day close of registration in April, and by then we should be able to see how rates of registration compare to prior years at this point and begin to make inferences about what it all means as we project to likely June turnout scenarios.
If there is a surge coming for this primary, or clear signs of a motivated electorate that forces us to rethink who exactly is a “likely” voter, maybe looking beyond recent vote history, the first signs will be coming shortly and seen by those of us who manage voter data on a daily basis.
—
Ed’s Note: Paul Mitchell, a regular contributor to Capitol Weekly, is the creator of the CA120 column, which explores 2016 election issues in California. He is vice president of Political Data Inc., and owner of Redistricting Partners, a bipartisan political strategy and research company.
Want to see more stories like this? Sign up for The Roundup, the free daily newsletter about California politics from the editors of Capitol Weekly. Stay up to date on the news you need to know.
Sign up below, then look for a confirmation email in your inbox.
Leave a Reply