News
Two million and counting: California’s early voters
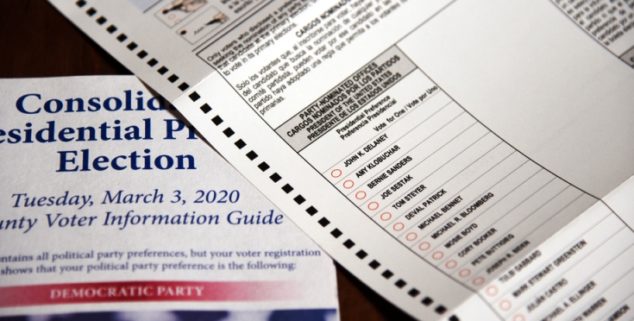 An iillustration of California's official voter information for the March 3 ballot. (Photo: Wild as Light, via Shutterstock)
The March 3 primary election is right around the corner, but nearly 2 million California voters have already cast ballots. As these voters mail in their ballots, many are receiving an email to participate in a Capitol Weekly survey asking about their experience, who they voted for and why.
This survey, conducted since the beginning of the early voting period, has reached more than 7,500 voters, nearly 6,000 who participated in the Democratic presidential primary.
Note, they are not a group representative of the overall electorate. These are voters who consistently return their ballots early, and they are generally older, whiter and higher in socioeconomic status than the electorate at large.
Here, for example, is the breakdown in three waves of early California voters who returned ballots in 2016 by age, plus the poll voters. The first ballots cast came from a population that was nearly half seniors, yet by Election Day this population was just 20% of votes being cast.
Rather than trying to take from these surveys and extrapolate to the full electorate, this survey is specifically looking at these early voters. As such, it is weighted to the population that has returned ballots. You can see below how this differs from the expected final turnout:
| Survey Weighting | Overall Democratic Primary electorate | |
| Democrats | 90% | 85% |
| Independents | 10% | 15% |
| Age 18-34 | 14% | 21% |
| Age 35-54 | 21% | 30% |
| Age 55-64 | 17% | 18% |
| Age 65+ | 47% | 31% |
| Latino | 20% | 27% |
| Asian | 10% | 8% |
| African American | 4% | 5% |
| White | 67% | 60% |
Knowing this is not a representative group, we have to be clear that this is not a poll intended to show who will win the California Democratic Primary overall. This is merely an exploration of the presidential results over time.
We will have a second set of survey results based on voters who returned their ballots before the South Carolina primary in order to see if attitudes have changed or if the voter choices for similar groups has shifted after the Nevada debate and caucuses.
With these caveats, here are the findings of the results of our survey. Crosstabs can be found here.
| In the Democratic Presidential Primary, who did you support? (N=5,746) | |
| Bernie Sanders | 27% |
| Michael Bloomberg | 20% |
| Pete Buttigieg | 15% |
| Elizabeth Warren | 13% |
| Joe Biden | 12% |
| Amy Klobuchar | 6% |
| Tom Steyer | 3% |
Sanders is the clear favorite, which is what we have seen in other polls. But this result might not have been expected, given the age and socioeconomic status of the earliest voters. This 27% results would be expected to rise as we get closer to Election Day.
The result for Bloomberg might be the most surprising part of this survey. He has steadily gained in polling to date, and appears to be the main challenger to Sanders among this first cohort of voters.
Buttigieg is on the precipice of earning statewide delegates — the hurdle is 15%. But that could be tenuous as we get closer to Election Day and the electorate becomes younger and more Latino – subgroups of the electorate in which Buttigieg underperforms.
Warren and Biden appear to have enough share of the electorate to earn some statewide delegates, and either could catch fire based on the coming debate or South Carolina performance.
The age breakdown of these voters is remarkable: Sanders isn’t just winning among younger voters, he is absolutely dominating.
| In the Democratic Presidential Primary, who did you support? (N=5,746) | |||||
| 18-34 | 35-54 | 55-64 | 65+ | ||
| Bernie Sanders | 69% | 38% | 21% | 12% | |
| Michael Bloomberg | 2% | 10% | 22% | 29% | |
| Pete Buttigieg | 7% | 16% | 18% | 17% | |
| Elizabeth Warren | 13% | 18% | 13% | 11% | |
| Joe Biden | 2% | 9% | 13% | 16% | |
| Amy Klobuchar | 2% | 3% | 7% | 9% | |
| Pete Buttigieg | 1% | 2% | 3% | 4% | |
As was seen in earlier polling, Buttigieg and Biden have stronger numbers with older voters. Younger voters who are turning in their ballots are not only solidly for Sanders, they are 82% in the progressive lane with Sanders or Warren. This could be representative of a much more motivated younger voter who mails in a ballot early.
The survey also looked at how voters are making their choices, and again there is a significant age breakdown.
| What best describes how you made your decision in the Democratic presidential primary? (N=5,746) | ||||||
| TOTAL | 18-34 | 35-54 | 55-64 | 65+ | ||
| Who agreed with me on the issues | 47% | 72% | 55% | 41% | 39% | |
| Who I believe could beat Donald Trump | 35% | 11% | 25% | 41% | 45% | |
| Who I liked the most | 17% | 17% | 20% | 19% | 16% | |
Younger voters are much more interested in a candidate that they are aligned with, which in this case appears to be Sanders or Warren, while older voters are more focused on who can beat President Trump, which appears to be Bloomberg, Buttigieg or Biden.
These results are only among the early votes, but they are also banked votes – they aren’t going to change if something big shakes up the race.
If, for example, Klobuchar was to catch fire in the next 10 days, she would have a very tough time getting into the top tier given that the first 25% of the vote is already in the mail.
Similarly, Biden, who is leading in South Carolina, could get a jolt out of a strong performance, but that could be muted if 40% of the California votes have been cast, and he’s under the delegate threshold with that portion of the ballots.
—
John Howard is the editor of Capitol Weekly.
Want to see more stories like this? Sign up for The Roundup, the free daily newsletter about California politics from the editors of Capitol Weekly. Stay up to date on the news you need to know.
Sign up below, then look for a confirmation email in your inbox.
Leave a Reply