News
CA120: When open primary voters tune out
 A street sign for voters. (Photo by Gustavo Frazao, via Shutterstock)
Elections are about choices. For many California voters, these choices are put in stark partisan terms: casting ballots strictly for all Democrats or all Republicans.
But the state’s new open primary gave us a new twist. Voters in the primary election can now choose to stay within their own partisan silos, just voting among candidates within their party. Or they can stray, picking candidates that appeal to them regardless of party.
Looking at the 52 legislative and congressional contests since 2012 that have had Democrat-vs.-Democrat, or Republican-vs.-Republican general elections, we find a wide swath of the electorate who are contributing to a new “undervote” phenomenon.
Then, come November, these voters just might find that their legislative or congressional race has two candidates from the same party vying for a seat. The open primary allows the top-two candidates to advance to the November ballot, regardless of party.
In 2014, for example, Sacramento voters in Assembly District 7 saw two Democrats, Kevin McCarty and Steve Cohn, advance to the general election. And in Orange County, two Republicans in Assembly District 74, Matt Harper and Keith Curry, were facing each other in a similar intraparty runoff where no Democrat advanced.
What are these partisan voters to do?
A Democrat might enjoy a second stab at a favorite Democrat in Sacramento, but that same Democrat transplanted to Orange County might be cringing at the decision between two Republicans.
In fact, some research shows that the Orange County Democrat, looking at a ballot with two Republican candidates, might not be able to really differentiate between them based on policies. With a kind of partisan color blindness, that Democrat might never be able to distinguish between different shades of Republicans, and might not vote for anyone.
Republican voters in Sacramento might just do the same thing, removing themselves from the process instead of trying to figure out which one of the two Democrats more aligns to their political views.
And that is exactly what is happening – more often than most people think.
Looking at the 52 legislative and congressional contests since 2012 that have had Democrat-vs.-Democrat, or Republican-vs.-Republican general elections, we find a wide swath of the electorate who are contributing to a new “undervote” phenomenon.
Undervote is a term used by election officials to describe a ballot that is cast but does not contain a vote in a particular contest.
And this undervote contains an unpleasant truth about the open primary: In some cases, voters from both sides just abstain from the process rather than serve as a counterbalance to extreme partisanship.
For those more mathematically inclined, this even gives a formula that can serve as a way to calculate this increased undervote as a function of the number of Republicans in a precinct.
In Sacramento, Kevin McCarty won his Assembly race, but when you look at the undervote by precinct, you see a distinct trend. In his Republican precincts, mostly in North Highlands and Antelope, fully 20% or more of the voters who showed up to vote didn’t cast a vote in his contest. This is in stark contrast to his Democratic precincts in midtown where only 2%-to-5% of voters failed to mark a choice.
This isn’t just a stand-alone phenomenon.
There have been 52 intra-party general elections for Assembly, Senate and Congress since the passage of the 0pen primary, and 20 of them have had undervoting at a rate greater than seen in the Kevin McCarty race.
During that time, none of the 300-plus Democrat-vs.-Republican general elections for any office has had a rate of undervoting close to this mark.
The following shows intra-party runoffs in which more than 15% of voters who cast ballots didn’t vote in the intra-party runoff:
| Year | Election | District | Candiates | Undervote |
| 2012 | Congress | 31 | Gary Miller (R) v. Bob Dutton (R) | 23% |
| 2012 | Assembly | 6 | Beth Gaines (R) v. Andy Pugno (R) | 19% |
| 2012 | Assembly | 72 | Travis Allen (R) v. Troy Edgar (R) | 19% |
| 2012 | Assembly | 19 | Phil Ting (D) v. Michael Breyer (D) | 19% |
| 2012 | Assembly | 10 | Marc Levine (D) v. Michael Allen (D) | 18% |
| 2012 | Assembly | 1 | Brian Dahle (R) v. Rick Bosetti (R) | 18% |
| 2012 | Assembly | 62 | Steven Bradford (D) v. Mervin Evans (D) | 18% |
| 2014 | Assembly | 74 | Matt Harper (R) v. Keith Curry (R) | 17% |
| 2012 | Assembly | 67 | Melissa Melendez (R) v. Phil Paule (R) | 17% |
| 2012 | Assembly | 5 | Frank Bigelow (R) v. Rico Oller (R) | 17% |
| 2012 | Assembly | 18 | Rob Bonta (D) v. Abel Guillen (D) | 17% |
| 2012 | Senate | 15 | Jim Beall (D) v. Joe Coto (D) | 17% |
| 2014 | Assembly | 76 | Rocky Chavez (R) v. Thomas Krouse (R) | 17% |
| 2012 | Congress | 8 | Paul Cook (R) v. Greg Imus (R) | 16% |
| 2012 | Assembly | 76 | Rocky Chavez (R) v. Sherry Hodges (R) | 16% |
While this undervote is large compared with an average 6% undervote in Democrat vs. Republican Assembly races, it doesn’t mean that undervote was a straight line, with 15%-to-20% of voters throughout the district choosing to not participate. In fact, in some part of all these districts, undervote was almost non-existent, at 3% or lower, while in others, primarily where the counter-party voters live, it ballooned.
Looking more closely at the Kevin McCarty Democratic intra-party general election, we can plot the undervote on a graph, with one axis as the percentage of voters that are Republican, and the other the percentage of undervote.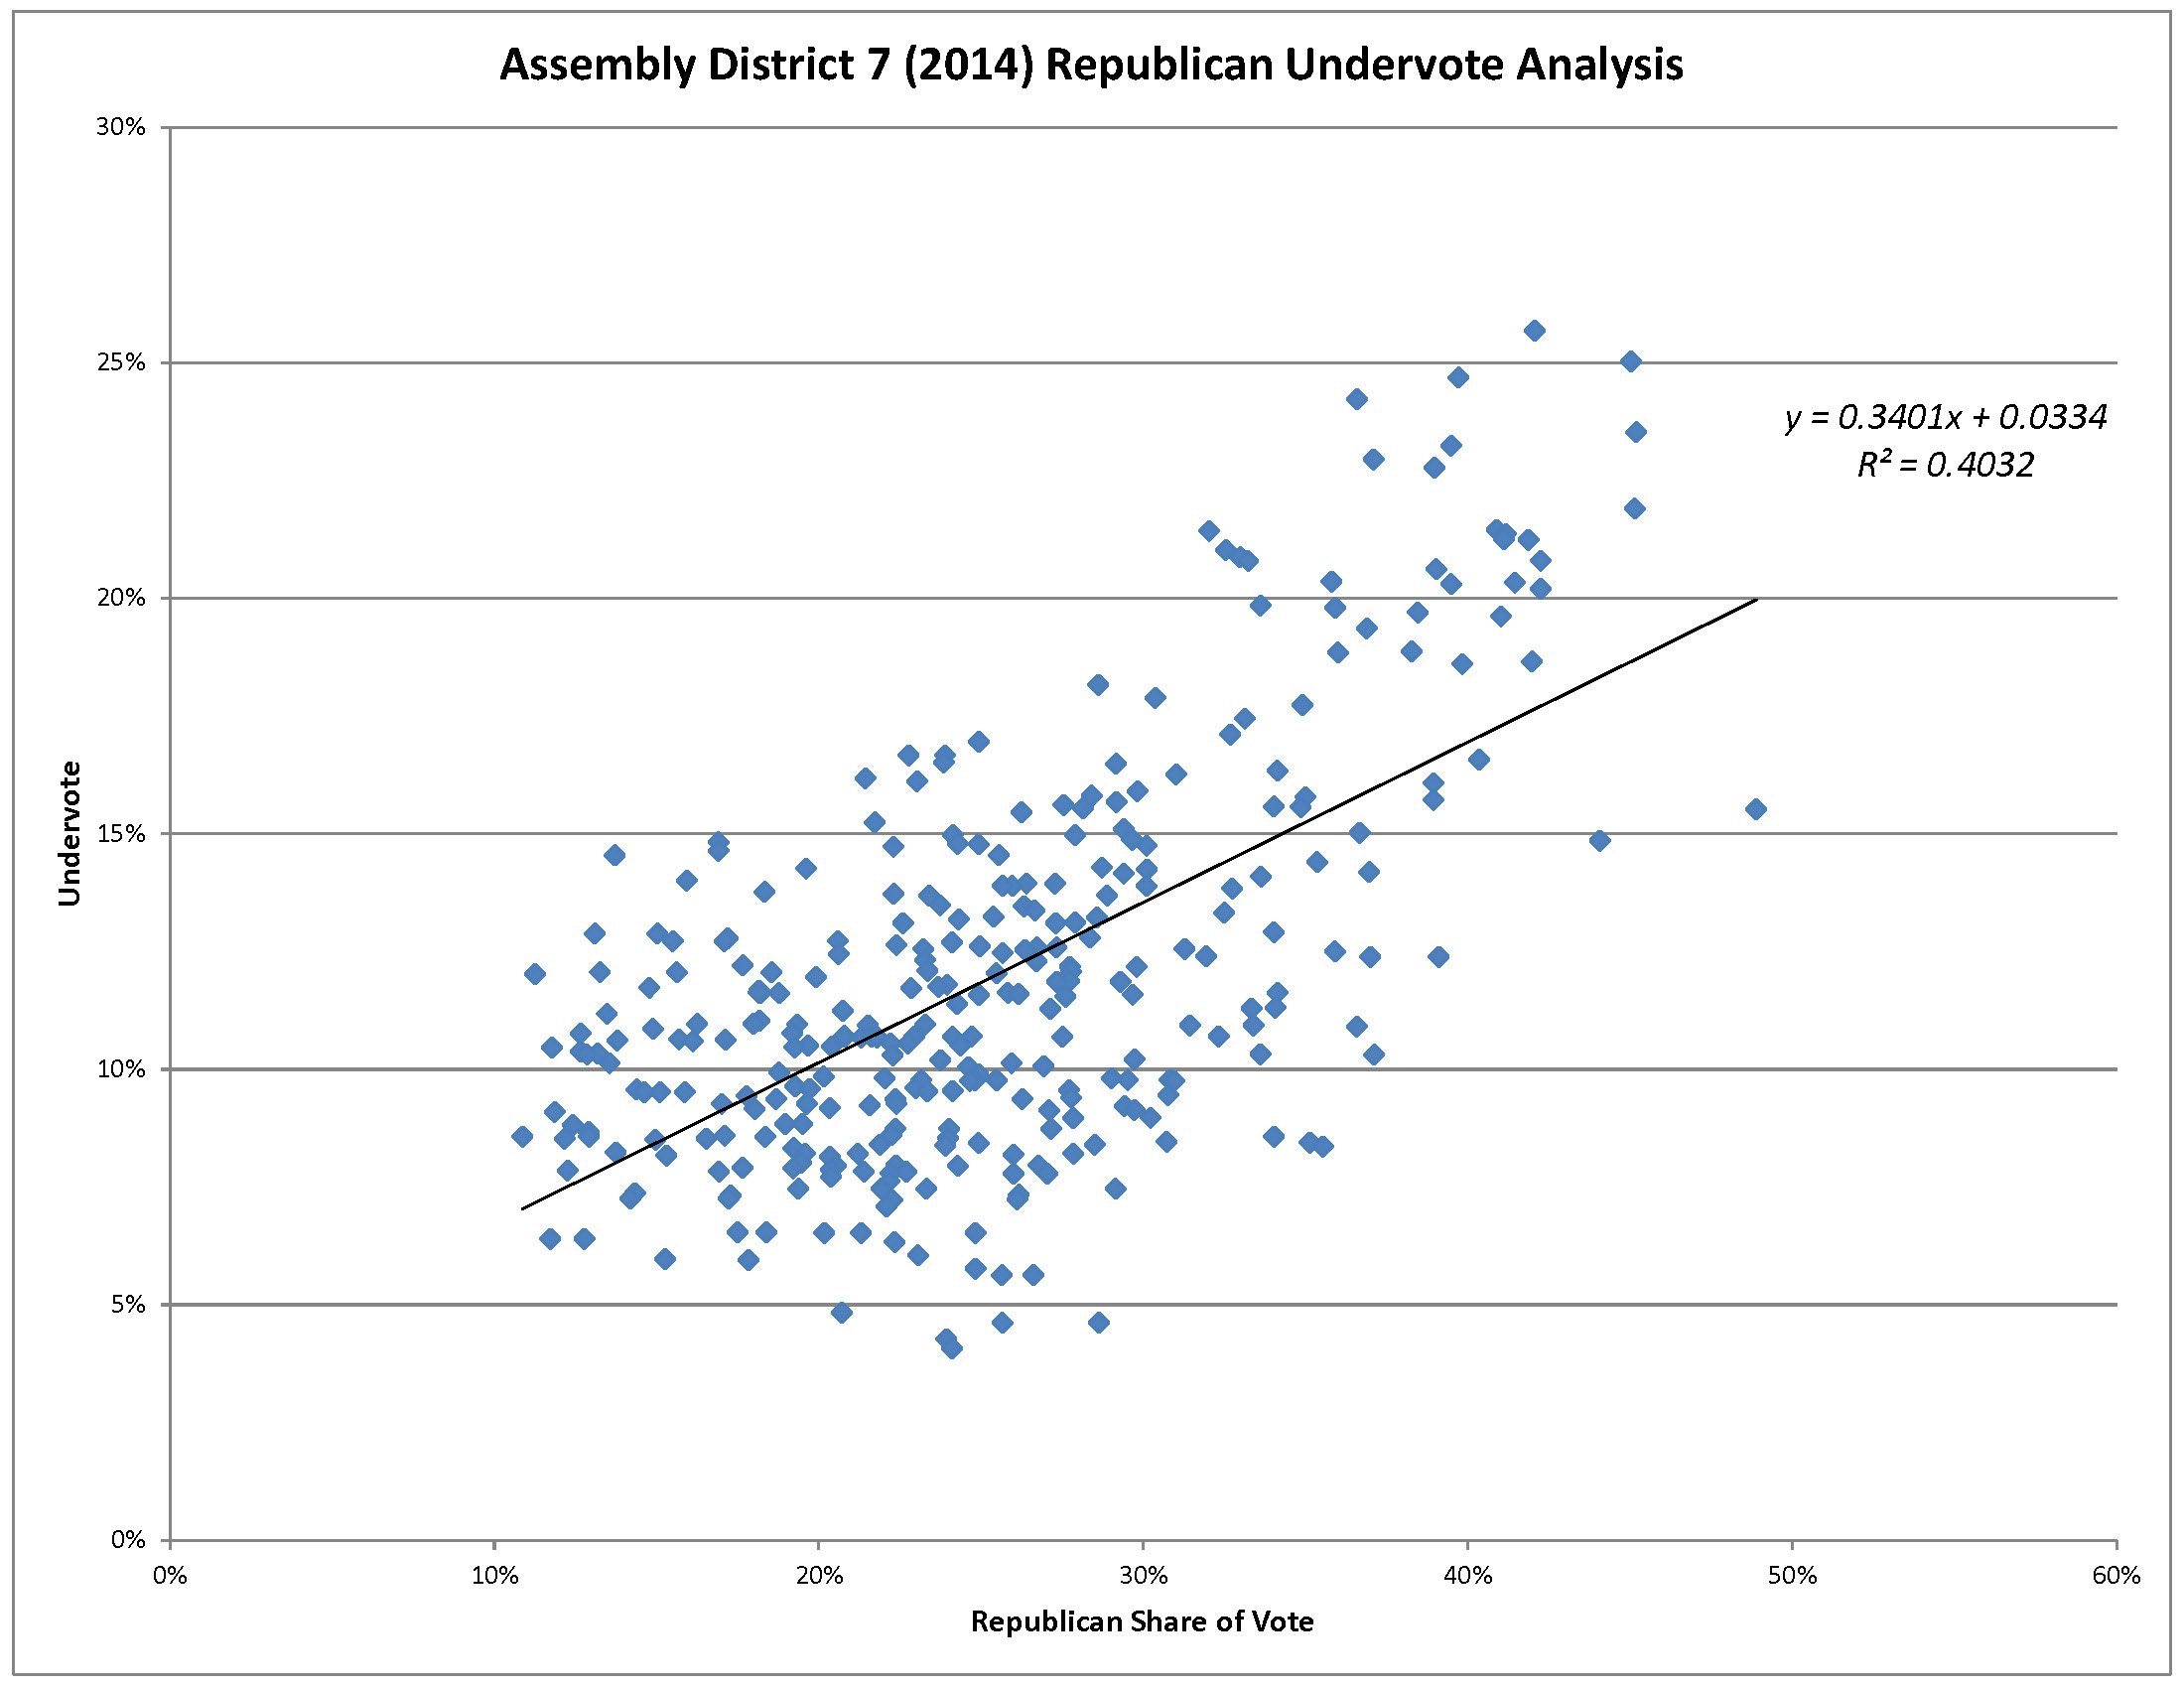
This scatterplot shows a clear pattern: The dots moving up depict a higher undervote as the percentage of Republicans increases.
For those more mathematically inclined, this even gives a formula that can serve as a way to calculate this increased undervote as a function of the number of Republicans in a precinct. Using this data, it can be assumed that approximately 35% or more of the Republicans in the McCarty-Cohn race failed to cast a ballot for either of the candidates.
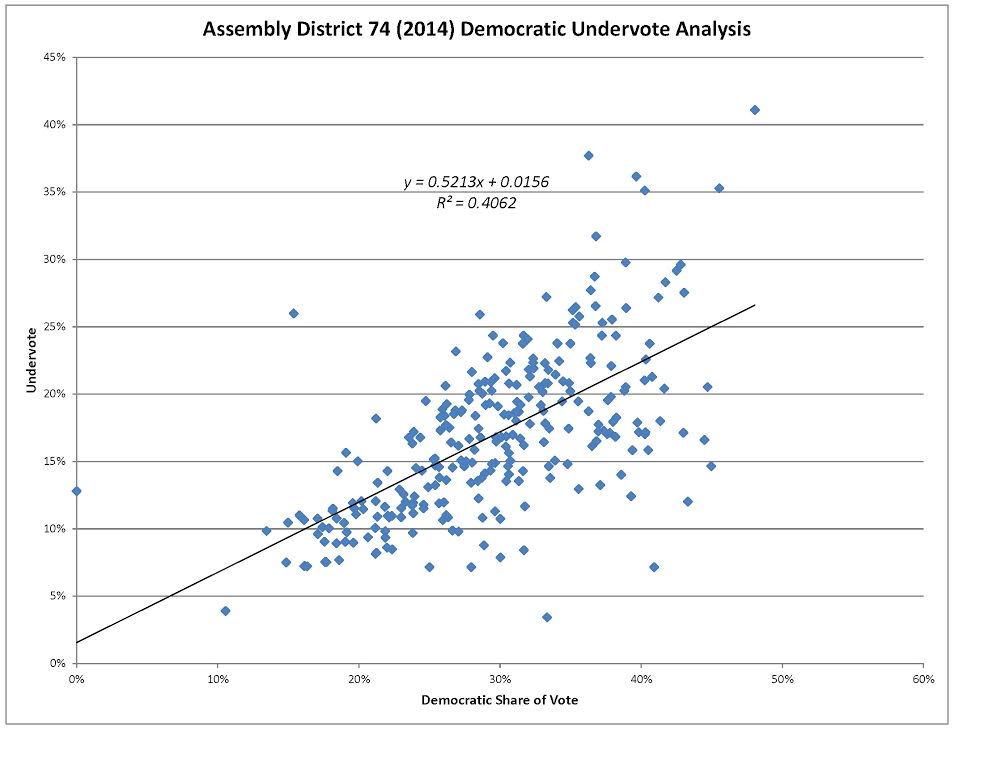
Let’s return to Orange County. There, Democratic voters in AD 74 reacted even more negatively to the presence of two Republicans on the ballot. The scatterplot and formula for the Democratic undervote in AD 74 suggests that 50% of Democrats in that district saw Matt Harper and Keith Curry on the ballot, and choose to leave that contest blank.
This growing phenomenon could serve to reduce the impact of the open primary, which backers hoped would use the so-called counter-party voters as way to check the most right- and left-wing candidates that were getting elected to the Legislature and Congress.
In southern California, there are two districts where the undervote didn’t appear to have the same partisan connection — until you looked more closely.
And, if a counter-party voter is not participating at the 35%-to-50% rate shown in these and dozens of other examples throughout the state, it has an impact on how campaigns allocate scarce resources.
Campaigns are reticent to spend money on people who have a 35%-to-50% chance of not turning out to vote. And they are concerned about spending money on voters who just skip their race, even if they do vote.
In southern California, there are two districts where the undervote didn’t appear to have the same partisan connection — until you looked more closely.
In Rocky Chavez’ 2012 and 2014 races in AD 76, and Melissa Melendez’ 2012 race in AD 67, the total undervote ranged from 16%-to-17%, although the graphs and formulas didn’t peg the vote to a strict partisan relationship.
When you unpacked the districts, particularly the Chavez seat, you can find an extremely strong Democratic undervote in the white precincts, but almost no undervote in the Latino precincts. This suggests that Latino Democrats were selecting a Republican candidate with a Latino last name, in the absence of any Democratic alternative, while white voters were not similarly swayed, and even more likely to skip that race on the ballot.
The less attention that intra-party runoff campaigns spend on these cross-party voters, the less likely they are to participate.
Could this undervote in Democrat-vs.-Democrat and Republican-vs.-Republican races be negatively impacting the goals of the open primary?
The new system was supposed to help moderate our elections by allowing independents and cross-party voters help determine who came out of the primary election, and who eventually won in the general. However, if the cross-party voters are disengaged, and 35%-to-50% likely to just skip the race, then we are losing that potential moderating influence.
Furthermore, campaigns are catching on to the fact that a message appealing to these cross-party voters, risking your core partisan support, is a tricky bargain, particularly when those you’re trying to influence are not voting. This also becomes self-reinforcing. The less attention that intra-party runoff campaigns spend on these cross-party voters, the less likely they are to participate, and the more expensive of a target they become.
One potential for campaign researchers is to actually model these voters.
Who among the cross-party voters in a Democrat-vs.-Democrat or Republican-vs.-Republican race is actually likely to vote? As we saw in the Chavez and Melendez examples, it appears that Latino Democrats will cross-over to vote for a Latino Republican when there are no Democrats on the ballot. So, this is one example of a universe that is likely, in a particular kind of contest, to exceed expectations.
It is possible that younger voters and infrequent voters are more susceptible to undervoting, as seen in the fact that the highest undervote was in 2012 when the presidential election brought out more of these kinds of voters. There could also be a difference between voters who cast a ballot at the polls, versus those who vote by mail, o\r among voters who live in households that are bipartisan, versus those pure Republican or pure Democratic households.
The open primary should mature, and it is possible that trends will change as more voters become familiar with intra-party general elections. But for this to happen, it would probably require a big statewide intraparty race for governor, U.S. Senate or another constitutional office.
And that’s something we may not see for a long, long while.
—
Ed’s Note: Paul Mitchell, a regular contributor to Capitol Weekly, is vice president of Political Data Inc., and owner of Redistricting Partners, a political strategy firm. This is the latest in a series of data-driven articles examining critical California issues in 2016.
Want to see more stories like this? Sign up for The Roundup, the free daily newsletter about California politics from the editors of Capitol Weekly. Stay up to date on the news you need to know.
Sign up below, then look for a confirmation email in your inbox.
This is a very valuable article. I like it a lot. But it has a slight flaw; it refers to our California system as an “open primary.” The author should refer to it as a top-two primary. “Open primary”,. as defined in several US Supreme Court opinions going back to 1981, and in political science textbooks going back 100 years, define “open primary” as a system in which any voter can choose any party’s primary ballot, but each party has its own primary and its own nominees.
So in the old system where the two parties faced each other there is “higher engagement” but it was total meaningless. When one party has a two to one vote margin based on party registration, the minority party’s voters could engage but not influence the outcome by voting based on their partisan affiliation. In the new system, it is up to the two candidates to give the voters of minority party a reason to vote for them.
Under each name should be one more category… Nether… Wonder how many votes that one would get?
Employing the same methodology, the researchers (it is not clear whether Mitchell did the research, or is reporting the results of others), should be able to identify how minority party voters voted. Those who abstained, may simply have not been prepared for the down ballot legislative races.
The result in AD 74 were the reverse of the primary. Was this due to Republican voters taking a second look at Curry and Harper, plus supporters of the third Republican strongly switching to Harper, as sometimes happens in states such as Texas where there is a runoff for partisan primaries? Or was Harper able to win based on a broader appeal?
In the AD 7 race in precincts that were 40% Republican, between 8% and 40% of voters abstained. Calculating the slope to four decimal places is silly when there is such divergence.
Mitchell is just correlating turnout of party-registered voters per precinct to the undervote, as recorded in the “statement of votes cast” published by each county registrar for each precinct. You can’t correlate between each individual ballot’s votes, since not only is each ballot not tied to an individual, but the markings on each ballot are not connected, beyond the precinct report.
[…] Read the full story in Capitol Weekly. […]