News
The counties’ shifting political tides
A quarter-century ago President George H. W. Bush was the last Republican to win California. It was 1988 and California Republican’s had the Governor’s office, one U.S. Senate seat, a number of statewide constitutional offices, and produced arguably the most revered GOP President of the 20th Century, Ronald Reagan. Democrats dominated the Legislature and Congressional delegation, but if anything California had a red hue.
But a great deal has changed and the electoral map now tells a different tale.
Although Bush was able to win California in 1988, he did it with just 51 percent of the vote to Dukakis’ 48 percent. Dukakis’ strength foreshadowed a changing state that was more diverse and socially accepting than the direction the national Republican Party was heading.
Dukakis’ won just 14 of the 52 counties, but it was still enough to garner him nearly half the vote. The 14 counties included most Bay Area and North Coast counties and Los Angeles County, a coalition of heavily Democratic counties that can sometimes put a Democrat over the top in a close election.
The changing political forces show an increasing division between the large urban and the small rural counties
Bush was the last Republican to win Imperial, Monterey, Napa, Sacramento, San Benito and Santa Barbara counties in a Presidential election.
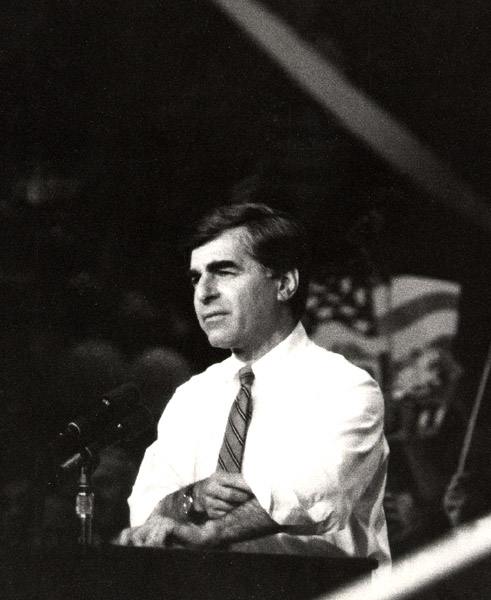
Mike Dukakis, UCLA, 1988
As California became more Democratic those Dukakis counties voted more and more Democratic by the time Obama was on the ballot in 2012. From the 1988 to 2012, San Francisco went from 73% to 83%, Alameda shifted from 65% to 79%, Santa Clara 52% to 70%, Contra Costa 51% to 66% and vote rich Los Angeles, 52% to 70%.
Counties that completely flipped from red to blue include many suburban and inland counties, with significant changes among populous Los Angeles suburban counties, Orange, Riverside, San Bernardino, Riverside and Ventura.
Obama increased Dukakis’ percentage in Orange County by 15 percent, from 31% to 46%. Riverside went from 40% to 50%, San Bernardino from 39% to 53%, and Ventura from 37% to 52%.
Obama may have been able to rack up 60 percent of the statewide vote, but Romney won 27 counties compared to Obama’s 25. It’s not a surprise given that many small North State counties are heavily Republican, but carry very little electoral power and are now fighting to create their own state of Jefferson.
Even in Orange County, a Republican stronghold, the GOP percentage drops.
While California became more and more Democratic, many of these small counties drifted the other way and actually voted for the GOP nominee at higher percentages in 2012 than in 1988. Modoc went from 63% to 69%, Lassen from 59% to 68%, Shasta from 59% to 63%, and Tehama from 57% to 62%.
Among the largest counties, it was a watershed victory for Obama. He carried 17 of the 20 most populous counties in the state, including every coastal county, except Orange and tiny Del Norte along the Oregon border.
In a state dominated by urban and suburban voters Romney only won rural counties, with the exception of Orange, Kern, Placer and El Dorado counties. Romney may have held those counties from 1988, but in Orange, the largest county by far the GOP percentage dropped 68% to 52%.
But the GOP remains strong in Kern County, a slice of Texas where oil fields and ten-gallon hats are a dominant part of the culture. The GOP vote went from 61% to 57% in Kern. The same is true in Placer and El Dorado counties, sometimes referred to as the Orange County of the north where nearly 6 in 10 voters supported in the GOP nominee in both 1988 and 2012.
Want to see more stories like this? Sign up for The Roundup, the free daily newsletter about California politics from the editors of Capitol Weekly. Stay up to date on the news you need to know.
Sign up below, then look for a confirmation email in your inbox.
I have never, ever seen a ten-gallon hat in Kern County. Otherwise a spot-on analysis. Kern has essentially become the reddest county in California among counties that actually have people in them.