
Micheli Files
Chart of 2026 bill volume of California legislative committees
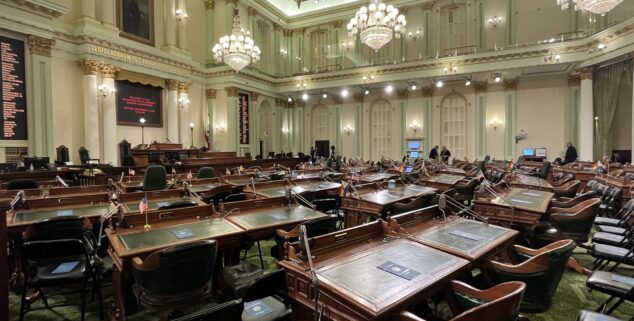 California Assembly Chambers, photo by Capitol Weekly.
 The California Legislature has a combined 57 standing committees, with 32 in the Assembly and 25 in the Senate. There were 1,846 bills (1,263 ABs and 583 SBs) introduced during the 2026 Legislative Session. Those standing committees, and their hardworking consultants (along with their minority party counterparts), reviewed and analyzed nearly two thousand bills during the past year.
The following charts provide the data for the original bill referrals to policy committees during the 2026 Session (meaning the first committee that received a bill from the respective Rules Committee). It does not include second or third bill referrals which increase the numbers below of bills heard by several committees, such as the Senate Judiciary Committee which analyzes and hears a significant number of bills as a second committee of referral.
2026 Assembly Committees and Original Bill Referrals
(Note that these figures do not include second committee referrals; and Appropriations and Rules Committees are not included; historically, about 80% of all bills go through the Appropriations Committee)
| COMMITTEE | ABs Referred | SBs Referred | Total Referrals |
| Aging and Long-Term Care | 10 | 7 | 17 |
| Agriculture | 30 | 3 | 33 |
| Arts, Entertainment, Sports, Tourism, and Internet Media | 23 | 3 | 26 |
| Banking and Finance | 41 | 8 | 49 |
| Budget | 122 | 120 | 242 |
| Business and Professions | 108 | 45 | 153 |
| Communications and Conveyance | 15 | 2 | 17 |
| Economic Development, Growth and Household Impact | 18 | 9 | 27 |
| Education | 161 | 40 | 201 |
| Elections | 68 | 27 | 95 |
| Emergency Management | 50 | 13 | 63 |
| Environmental Safety and Toxic Materials | 48 | 19 | 67 |
| Governmental Organization | 70 | 27 | 97 |
| Health | 226 | 73 | 299 |
| Higher Education | 112 | 25 | 137 |
| Housing and Community Development | 138 | 51 | 189 |
| Human Services | 112 | 25 | 137 |
| Insurance | 49 | 31 | 80 |
| Judiciary | 168 | 81 | 249 |
| Labor and Employment | 73 | 28 | 101 |
| Local Government | 88 | 71 | 159 |
| Military and Veterans Affairs | 10 | 4 | 14 |
| Natural Resources | 153 | 50 | 203 |
| Privacy and Consumer Protection | 64 | 29 | 93 |
| Public Employment and Retirement | 44 | 12 | 56 |
| Public Safety | 269 | 78 | 347 |
| Revenue and Taxation | 93 | 39 | 132 |
| Transportation | 115 | 52 | 167 |
| Utilities and Energy | 104 | 49 | 152 |
| Waters, Parks, and Wildlife | 75 | 29 | 104 |
| TOTALS | 2,657 | 1,050 | 3,707 |
2026 Senate Committees and Original Bill Referrals
(Note that these figures do not include second committee referrals; and Appropriations and Rules Committees are not included; historically, about 80% of all bills go through the Appropriations Committee)
| COMMITTEE | SBs Referred | ABs Referred | Total Referrals |
| Agriculture | 3 | 26 | 29 |
| Banking and Financial Institutions | 7 | 19 | 26 |
| Budget & Fiscal Review | 122 | 120 | 242 |
| Business, Professions and Economic Development | 53 | 102 | 155 |
| Education | 66 | 197 | 263 |
| Elections and Constitutional Amendments | 23 | 52 | 75 |
| Emergency Management | 10 | 12 | 22 |
| Energy, Utilities and Communications | 48 | 70 | 118 |
| Environmental Quality | 60 | 75 | 135 |
| Governmental Organization | 48 | 80 | 128 |
| Health | 65 | 138 | 203 |
| Housing | 32 | 80 | 112 |
| Human Services | 30 | 80 | 110 |
| Insurance | 17 | 25 | 42 |
| Judiciary | 65 | 185 | 250 |
| Labor, Public Employment and Retirement | 57 | 84 | 141 |
| Local Government | 57 | 68 | 125 |
| Military and Veterans Affairs | 4 | 5 | 9 |
| Natural Resources and Water | 47 | 90 | 137 |
| Privacy, Digital Tech, and Consumer Protection | 11 | 19 | 30 |
| Public Safety | 83 | 156 | 239 |
| Revenue & Taxation | 63 | 35 | 98 |
| Transportation | 47 | 61 | 108 |
| TOTALS: | 1,018 | 1,779 | 2,797 |
As can be seen by the charts above, several thousand bills are analyzed each year of the California Legislature’s biennium session, and this year is no different. An interesting note is the number of first referrals in the second house in comparison to the house of origin.
Want to see more stories like this? Sign up for The Roundup, the free daily newsletter about California politics from the editors of Capitol Weekly. Stay up to date on the news you need to know.
Sign up below, then look for a confirmation email in your inbox.
Leave a Reply