Analysis
California’s homicide numbers can be misleading
 An officer exits his vehicle prior to conducting a search in Ventura. (Photo: Glenn Highcove, via Shutterstock)
In late July, the Office of the Attorney General released Homicide in California 2020, its annual report on the state’s murders.
Media outlets in California and elsewhere quickly covered the report. The story, targeting a “31 percent increase in murders,” was reported by a variety of news organizations. They included an array of print and broadcast media: the The San Francisco Chronicle, Fox News, AP, Los Angeles Times, San Jose Mercury News, San Mateo Daily Journal, KTVI News Bay Area, NBC Bay Area, ABC10 News Sacramento, KPBS San Diego, Vacaville Reporter, Redding Searchlight and Axios. Not surprisingly, the report fueled backers of the recall drive against Gov. Newsom.
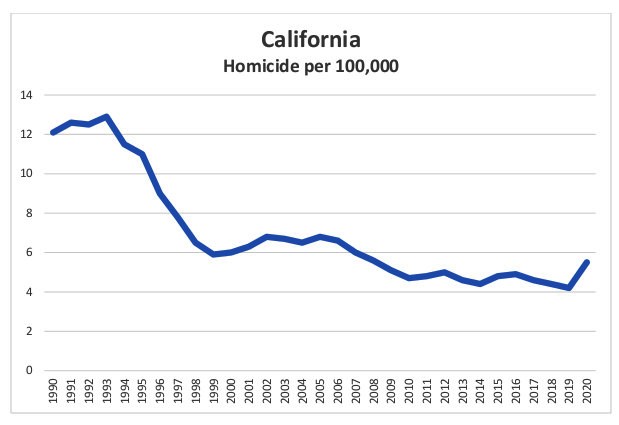
California homicide rates per 100,000 inhabitants, 1990-2020. (Source: State Department of Justice)
Republican talk show host Larry Elder attributed the “31% increase” to a “soft-on-crime ethos we see emanating from Sacramento and from many of our major cities.” Kevin Faulconer blamed Newsom for California’s “13-year high in homicides.” Other Newsom critics such as Kerry Jackson of the Pacific Research Institute lay blame of the “31% increase” on the governor.
But the numbers are misleading, and the “31 percent increase” stems from the executive summary in the report, although without explanation, context and historical perspective. While it is important to track the number of homicides that occur in certain years, year-by-year comparisons of raw numbers are misleading, because such comparisons do not take into account population changes and distribution.
Most importantly, the numbers most heavily reflect statistics from California’s most populace counties, suggesting the increase is consistent statewide. In fact, nearly two-dozen California counties had no murders at all, according the report.
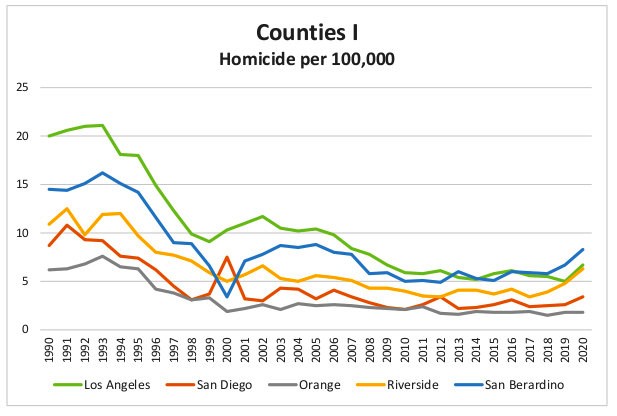
Homicide rates per 100,000 inhabitants in five major California counties, 1990-2020. (Source: State Department of Justice)
Another issue: California’s DoJ only accepts reports of “actual homicides” as defined by the FBI’s Uniform Crime Reporting Handbook, and that data doesn’t necessarily jibe with what individual law enforcement agencies report.
The crime rate, an integral part of analyzing crime statistics, is defined as “the number of crimes reported to law enforcement agencies per 100,000 total population … calculated by dividing the number of reported crimes by the total population; the result is multiplied by 100,000.”
The state report noted that the “2,202 homicides last year were 523 more than in 2019, while the rate increased by a similar margin — from 4.2 to 5.5 homicides per 100,000 people.”
In a large state like California, where the population is dispersed unevenly and county-by-county density often is dramatically different, the only way to get as true a picture as possible is to calculate and compare crime rates.
When the crime rate is used for homicides and broken down over counties and years, the story the headlines and partisan politicians tell starts to wither.
The Department of Finance estimates that 39,782,419 people live in California. That population is spread across 58 counties, the largest being Los Angeles County with 10,135,614 people, more than three times the population of San Diego County, the second largest county with 3,331,279 people.
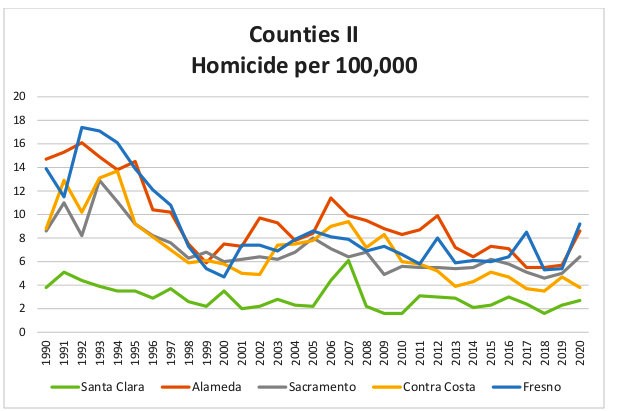
Homicide rates per 100,000 inhabitants in five additional California counties, 1990-2020. (Source: State Department of Justice)
Along with Los Angeles and San Diego, there are eight more counties with population over 1 million. There are 11 more counties with populations over 400,000. Not only do most California counties have a population of under 200,000, twenty-two counties are home to less than 100,000 people each, with Modoc (9,563), Sierra (3,200), and Alpine (1,146) all in the four-digits.
Given the obvious disparities in California county populations, it is clear that a reporting a single, statewide homicide crime rate does not fit all.
While California’s homicide rate overall for 2020 is 5.5 per hundred thousand people, in the 22 counties with a population of under 100,000, the 2020 homicide rate was 0.0.
That doesn’t mean that these counties didn’t experience any homicides, they did — 41 to be exact. It’s just that the numbers — apparently — were not large enough to show up as a statistic on the state report.
The 22-county 2020 homicide count of 41 is up from 2019 (40) and nearly double of 2018 (22), but broken down among the 22 counties, we see that the details in the counties matter.
A good example is Mendocino County over the period from 2015 to 2020.
According to the state, the total homicides for those years were six in 2015, eight in 2016, four in 2017, 13 in 2018, three in 2019, and six in 2020.
Using the figures above, one could say that Mendocino County homicides doubled from 2019 to 2020. One could also report that 2020 homicides were slightly lower than the 6.6 per six-year average, or that the 2020 homicide count is less than half that of 2018.
But Mendocino observers looked at the six-year homicide run and thought something was clearly hinky, citing local law enforcement sources.
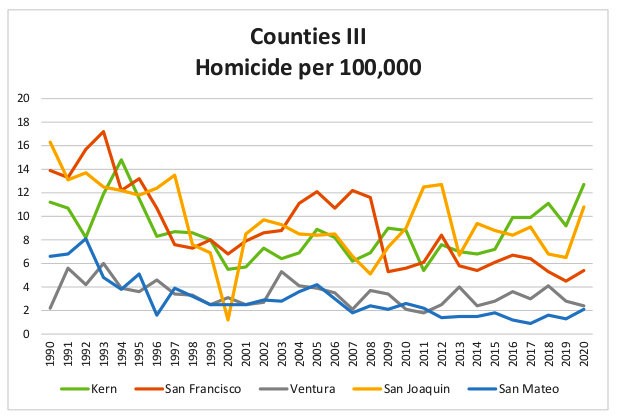
Homicide rates per 100,000 inhabitants in five more California counties, 1990-2020 (Source: State Department of Justice)
In April, the Mendocino Voice reported, “There were 14 deaths in Mendocino ruled homicide in 2020, 10 of which the Sheriff’s Office dealt with, compared to 8 in 2019, 18 in 2018 (the Hart family homicides accounted for 6 of those), 8 in 2017, 12 in 2016, 11 in 2015 … according to the Sheriff’s Department figures.”
The numbers in reported to the Voice by the Mendocino County Sheriff’s Department are higher than what Mendocino County reported to the California Department of Justice, and for good reason.
Everything pertaining to Mendocino and smaller counties also applies to California’s top 20 most populous counties – Los Angeles, San Diego, Orange, Riverside, San Bernardino, Santa Clara, Alameda, Sacramento, Contra Costa, Fresno, Kern, San Francisco, Ventura, San Joaquin, San Mateo, Stanislaus, Sonoma, Tulare, Santa Barbara, and Monterey.
There is no uniformity between the top-20 counties on the difference between homicide rates in 2019 and 2020.
Comparing homicide or any crime statistics year-by-year gives us no idea of what long or even short terms crime trends are.
In six counties, there was a significant increase in the homicide rate (3-plus points), while nine counties saw a slight increase (1 to 2 points). One saw no change over the two years and four reported a decrease.
The biggest increase was not in Los Angeles County, which only saw a slight uptick in homicides, but in the Central Valley counties of Kern, Fresno, and San Joaquin.
Finally, comparing homicide or any crime statistics year-by-year gives us no idea of what long or even short terms crime trends are. Homicide data is most useful when it is presented historically, ideally over several decades.
Looking at homicide rates in California and many of its counties, there is indeed an uptick from 2011 to 2020, though after two separate years of noticeable decline.
However, pull back to 2001 and the homicide rate is moderately higher than it was in 2020. Advance a few years to 2006, when there was a statewide jump in murders, and there is a significant decline in homicides between these two points.
The homicide rate gap becomes a chasm when one goes back to the 1990s, especially during the thick of the War on Drugs and gang wars. In 1990, the statewide homicide rate was 12.1 per 100,000. In just two years, it had climbed to 12.9. In Los Angeles County, which was driving the statewide rate, there were 20 homicides per 100,000 in 1990. Two years later it peaked to 21.1.
However, after the 1993 peak, the state (and county) homicide rates started to drop. As the county-by-county graphs show, the decline was not uniform among the counties, nor did it occur in one continuous decline.
In some counties there were years when the homicide rate jumped. Immediately, these jumps are reported as “spikes.” However, when looked at over time, it becomes apparent that what we are seeing is a temporary blip and not a long-term trend.
Unlike car theft, fraud, or robbery, homicide is most often an irrational act, one born of passion and committed on impulse. Life events such as a relationship break-up, discovery of a partner’s infidelity, loss of a job, a business failure, or the increased pressure of a pandemic can drive people to kill.
When people do kill, they most often murder someone that they know. The A.G.’s Homicide Report states that 40.7% of people murdered are killed by a member of the immediate family, a friend, an ex-, an employer, an employee, or a fellow gang member. Only 35.6% of homicides are committed by a stranger.
Most homicides (40.8%) are the end result of an argument. The vast majority of the murders in these cases occur among friends or family, especially in cases of murder resulting from domestic violence. One-third of homicides related to arguments occur in the home of the perpetrator or the victim, followed by a parking lot.
Gang related killings make up 31.1% of homicides. As with arguments, most people involved in gang-related homicides know each other (60.9%).
Compared to argument-based and gang-related homicides, the two crime related homicides that most people fear – murder occurring during a robbery (7.8%) or rape (8.5%) – are relatively rare.
None of this is to downplay the seriousness of homicide, especially for the victims and their families.
But by understanding the numbers, we can save ourselves from bad policy decisions based on in-the-moment politics — decisions that can take decades to repair.
Want to see more stories like this? Sign up for The Roundup, the free daily newsletter about California politics from the editors of Capitol Weekly. Stay up to date on the news you need to know.
Sign up below, then look for a confirmation email in your inbox.
Leave a Reply