CA120
CA120: Harris still polling very strong in California
 Vice President Kamala Harris
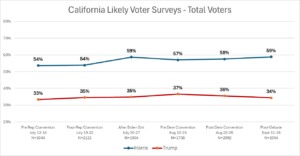
The latest Capitol Weekly polling of California voters shows continued strength for Vice President Kamala Harris in the presidential race, with 59% of voters supporting Harris and 34% supporting former President Donald Trump. This result for Trump matches his 2020 result in the Golden State, when he earned 34% of to vote against President Joe Biden who obtained 63%. It is higher than his 31% of the vote against Secretary Hillary Clinton in 2016.
The trend in the contest between Harris and Trump has been fairly stable since Biden exited the race in late July. The current advantage of 25-points is within one-point of the polling when she first got in the race after the Biden exit.

This latest result shows little movement after the debate, despite California voters strongly believing that she had a strong performance.
Among Likely Voters who responded to the poll, 88% said they watched the debate, including 90% of Democrats. Of these, over 2/3rds said Vice President Kamala Harris won the debate, with only a quarter of voters saying that former President Trump won.
|
Do you think Donald Trump or Kamala Harris performed better in the debate? |
|||||
| Total | Dem | Rep | NPP/Other | ||
| Kamala Harris | 68% | 94% | 25% | 59% | |
| Donald Trump | 24% | 3% | 58% | 28% | |
| Don’t Know | 9% | 3% | 17% | 13% | |
The 24% of voters who said Trump won the debate is ten points lower than the 34% that Trump receives in the presidential contest. While 99% of Kamala Harris supporters and 94% of Democrats thought she won the debate, only 65% of Trump supporters and 58% of Republicans believe Trump won the debate.
In the leadup to the debate, New York Times / Sienna polling found that 28% of voters wanted to learn more about Kamala Harris. This lead many to suggest that Kamala Harris’ goal shouldn’t be zingers, but using the debate as a platform for talking about her policy positions.
We asked voters if they learned more about the policy positions of each candidate, and Harris came out on top, with 54% saying they learned more about her policy positions, compared to 35% for Trump. Yet, national polling has shown that voters still claim that they need to learn more about Harris and are not hearing about her specific policy proposals. These are likely factors leading to Harris calling for a second debate between herself and Trump. Voters who are looking to learn more about her or her policies could then have another opportunity to tune in to a format which she has shown is a strength for herself and her campaign.
There have now been two additional statewide polls of the Harris/Trump contest, one from Berkeley IGS, conducted by the former head of the Field Poll, Mark DiCamillo, and the other from the Public Policy Institute of California, conducted by Mark Baldassare and Dean Bonner.
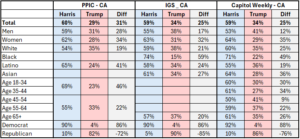
Comparing the three polls shows relatively consistent topline results, with Harris leading Trump by a wide margin, with the PPIC poll showing the strongest lead at over 30-points. The main difference in the three polls may be the expectation for Republican share of the electorate, with PPIC putting Republicans at just 25% of November turnout, while the IGS survey used 27% and we have consistently been using 29% for the Capitol Weekly polling.
The Capitol Weekly poll has consistently used the same weighting for partisans, even with the late Harris entrance to the race – which may end up driving higher share of Democrats and pushing the Republican share down. This could be reason to believe that the Capitol Weekly is less rosy on Democrats prospects while others may conclude that the PPIC poll is overly sour on Republican turnout prospects.
The following shows some breakdowns of Harris/Trump numbers for the three polls. Note: there are differences in the crosstabs reported by each. For example, each poll reports age groupings in different ways. And the PPIC study does not do a separate calculation of Black or Asian voters in their crosstabs.

Two areas that are interesting to look at in the crosstabs for the two polls are the Latino vote and the Gender gap.
The PPIC poll shows a 6-pt gender gap with men favoring Harris by 28-pts and women favoring her by 34-pts. The IGS poll has the gender gap at 15-pts with Harris ahead by 17-points among men, and 32-pts among women, with Capitol Weekly at a 23-pt gender gap, seeing Harris ahead by 12-points among men and a whopping 35-points among women. This is a wide spread – from 6 points to 28 points.
Additionally, the Latino vote shows a large spread in the findings among that subgroup. The Capitol Weekly poll shows much stronger Trump numbers among Latinos, at 36%, while IGS shows a similar 34% and PPIC is at only 24%. The Harris lead among Latinos in each poll ranges from 41-points from PPIC to just 19-points for Capitol Weekly. A clear part of the difference is in-language Spanish surveys – PPIC and Berkeley have Spanish language options, while the Capitol Weekly survey does not. However, the Berkeley and Capitol Weekly results are much closer to each other, varying only by 1-point, and less than 15% of likely Latino voters receive Spanish language ballots.
One final difference in the three polls is general methodology. The Berkeley and Capitol Weekly surveys are similar, starting with voter file data from Political Data, and then Berkeley sends surveys to voters via email links to online surveys, while Capitol Weekly does the same, but also sends text message links to surveys to supplement the email sends. PPIC historically has used non-voter file approaches like Random Digit Dialing and an online panel to complete surveys. This methodology is better at reaching non-registered voters, which is important to PPIC’s mission which is not only to poll the electorate, but also all Californians, as they build data on general public opinion among all adults. But with this non-voter file approach, PPIC has to rely on self-identified partisanship and vote propensity. While each approach is legitimate and higher quality than other public polls, like SurveyUSA, these differences in methodologies can definitely cause differences in poll findings.
Crosstabs of this poll and each of the pre and post-convention polls, can be found here: https://tinyurl.com/CA120ConventionPolls
Want to see more stories like this? Sign up for The Roundup, the free daily newsletter about California politics from the editors of Capitol Weekly. Stay up to date on the news you need to know.
Sign up below, then look for a confirmation email in your inbox.

Leave a Reply