Recent News
CA120: Voter registration: The 2018 spike is not what it seems
 Photo illustration of of highway alerting people tom coming elections. (Image: Jim Vallee, via Shutterstock)
 Earlier this year, the state established a new system that could fundamentally change the relationship between Californians and their voter registration.
In a series of changes—most notably the way that voter sign-ups are done at the Department of Motor Vehicles—California has entered an era of nearly automatic voter registration.
This system is already having an impact on our state voter file. The most recent county-level records from Political Data Inc. show a spike in registrations that is on pace to be greater than any prior gubernatorial election cycle.
| YEAR | TOTAL | DEM | REP | NPP/OTHER | |||
| 2006 | 279,897 | 105,305 | 38% | 90,777 | 32% | 83,815 | 30% |
| 2010 | 1,005,789 | 371,597 | 37% | 333,781 | 33% | 300,410 | 30% |
| 2014 | 693,923 | 276,364 | 40% | 137,983 | 20% | 279,574 | 40% |
| 2018 (to date) |
898,724 | 328,157 | 37% | 155,980 | 17% | 414,587 | 46% |
It is also has the highest rates of “no party preference,” with 46% of the registrations. In raw numbers, there are already more NPP and other registrations in 2018 than any of California’s past three gubernatorial cycles.
Some of this might stem from voter enthusiasm. But there is evidence that the change is really being driven by structural changes, rather than the individual motivations of voters.
The most striking data shows how much re-registration is occurring.
Looking at just the three-month period from the June primary election to the first week of September, we have seen a five-fold increase in re-registration compared to 2014—from just over 100,000 in the last gubernatorial cycle to more than 550,000 in 2018.
Presidential election cycle registration generally swamps gubernatorial cycles. But this year, for the first time, re-registrations in the gubernatorial cycle are on pace to be higher. The 2016 cycle was historic, with nearly 25% of the state’s entire 20 million voters registering or re-registering in the lead up to the general election.
Some of this incredible growth in new and re-registrations is coming in the state’s most competitive congressional districts.
However, 2018 is showing a 60% jump for this three-month window—210,000 more re-registrations than the approximately 340,000 in that supercharged year.
To put in simple terms: We are quickly reaching a million new and re-registrations, and we’re hitting that mark faster than ever in the state’s history.
Some of this incredible growth in new and re-registrations is coming in the state’s most competitive congressional districts. Two in particular—the 39th District with Young Kim (R) facing Gil Cisneros (D), and the 45th District with Mimi Walters (R) vs. Katie Porter (D)—have seen a tripling of total registrations and nine-fold increases in re-registration compared to 2014.
In fact, all the Orange County competitive congressional districts have outpaced the rest of the state in terms of new and re-registrations.
But all the competitive districts combined only account for 20% of this activity, with the other 80% coming from the rest of the state where there aren’t the same dynamics at play.
Among just those voters who registered to vote at the DMV in July of this year, 22% of all Democrats and Republicans who registered at the DMV changed to no party preference.
With this ballooning of registrations, we are also seeing a dramatic shift in partisanship, or lack thereof.
As The Sacramento Bee pointed out in a recent story, more than half of the voters coming out of the DMV registration process are selecting to be no party preference. In many cases, these voters were previously Democrats and Republicans.
We see the same dynamic looking at these registrants and comparing their NPP status to prior voter registrations. Among just those voters who registered to vote at the DMV in July of this year, 22% of all Democrats and Republicans who registered at the DMV changed to no party preference. This is several times higher than the 6% that changed to NPP using the online system, or the 3% that changed using traditional paper forms.
NPP registrations spiked as high as 60%, with Democrats falling to 30% and Republicans falling to 15-18%.
Looking at the data in this chart, you can clearly see how DMV registrations had traditionally been fairly stable with Democrats and NPP registration in a range of 35-40%, and Republican registration around 25-28%.
But, with the implementation of the new process, this changed dramatically. NPP registrations spiked as high as 60%, with Democrats falling to 30% and Republicans falling to 15-18%.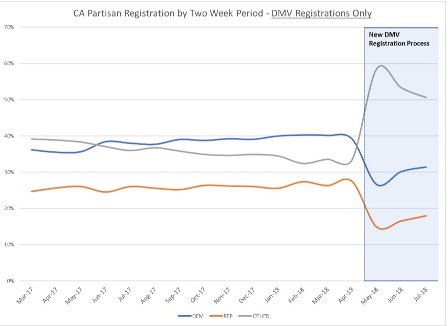
Even more striking than the growth of registration and spike in NPP is the fact that we are seeing historic partisanship changes.
As the following chart shows, the last major bump in partisan changes was prior to the 2016 Primary Election when there was a massive number of voters switching to Republican in advance of the state’s closed Republican presidential primary. (And then a subsequent small bump in voters after the primary switching back to NPP/Other.)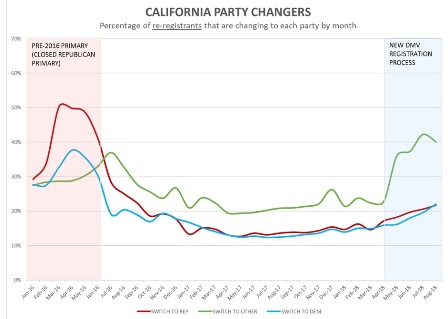
This chart includes all kinds of re-registrations—paper, online and DMV. And you can see the spike in NPP/Other switches among voters who are re-registering. However, if we isolate to just the DMV registrations, we see an even more dramatic shift.
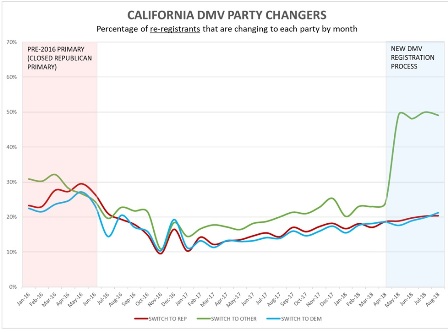
A whopping 50% of the NPP registrants who have come out of the DMV were at one time Democrats or Republicans.
Some of this incredible growth in new and re-registrations is coming in the state’s most competitive congressional districts. Two in particular – the 39th district with Young Kim (R) facing Gil Cisneros (D), and the 45th district with Mimi Walters (R) vs. Katie Porter (D) — have seen a tripling of total registrations and nine-fold increases in re-registration compared to 2014.
This data shows some spectacular changes in the total amount of voter registration, and how the DMV process is changing the electorate.
In a survey conducted by CA120 and Political Data for Capitol Weekly, we queried 2,800 recently registered voters, including more than 1,200 DMV registrants, about their experience.
While this clearly shows that the automatic voter registration is having an impact on both the number of people who are registering, and the partisanship, it doesn’t answer the questions of voter motivation.
Are these voters registering because they want to, or is it happening without their knowledge? Are these new independent voters selecting NPP because of a disillusionment with the parties, or is it something to do with how the registration process is being administered?
In a survey conducted by CA120 and Political Data for Capitol Weekly, we queried 2,800 recently registered voters, including more than 1,200 DMV registrants, about their experience, if they remember registering and with which party they thought they registered.
DMV registrants: The CA120 survey results
We looked at the data behind the current surge in voter registration, and the clear shift to NPP registrations—particularly among those who registered at the DMV in the last few months.
Of the more than 1,200 polled voters who had their registration updated at the DMV, we had an almost exact 50-50 split,
But the real question is if this was something that was done on purpose—with more than half of DMV registrants deciding to abandon the two major political parties, or if this was something done without their knowledge.
Of the more than 1,200 polled voters who had their registration updated at the DMV, we had an almost exact 50-50 split, with 621 remembering the voter registration, and 618 saying they did not register or didn’t remember.
When conducting the survey we also received several rather concerned emails from voters who were adamant that they did not register, and that this must have been an error, or even a sign of voter fraud. However, in each case, we were able to identify the more recent registration date, and in each case the voter said that, yes, in fact, they had gone to the DMV on that day.
This poll shows something that many pollsters see on a regular basis: Voters misidentify their own party registration.
While it might be shocking to many voters to find out that their registration was updated, even potentially without them knowing it, this is hardly an indictment of an “automatic” voter registration system. And, according to the Secretary of State’s office, these voters were all given a receipt for their registration, so whether they noticed or not isn’t really a test of whether the system is working.
Often registrants can’t correctly identify their partisan registration – but this is particularly bad among NPP registrants from the DMV.
We tend to believe that partisan registration is a deeply felt identification. And for people who might be reading this article, this is likely true.
However, this poll shows something that many pollsters see on a regular basis: Voters misidentify their own party registration.
This poll shows that on average, 12% of registrants don’t correctly identify their how they are registered. Much of the time, the confusion has to do with whether they are an independent or not. Commonly, voters identify themselves as Democrat or Republican, because that’s how they vote, but they may be registered as NPP.
What gets interesting is when you break this out for new registrants by how they registered – if it was at the DMV, using the state’s online registration system, or with a traditional paper form or registration drive.
As the following table shows, 31% of NPP voters who registered at the DMV since the implementation of the new registration system thought they were currently registered as a Democrat or Republican. This is much lower for those who registered to vote online (14%) or using paper forms (19%).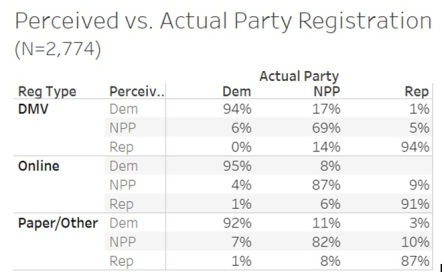
While this confusion exists with NPP, there are only very small numbers of Democrats who think they are Republicans (0-1%) and Republicans who think they are Democrats (1-3%).
When informed that they were identified in their most recent registration as a NPP voter, 95% of those who registered online and 92% of those who registered by paper confirmed that this was their intention. Among those who registered as NPP at the DMV, only 77% said this was intentional, with 23% saying this was not. Among Latinos, only 72% said it was intentional, and among African Americans it dropped further to 69%.
The greatest unplanned NPP registrations are among those DMV registrants who didn’t remember registering at the DMV. Of these voters, 69% said their NPP status was intentional, with 31% saying it was not. And this rate of unintentional NPP registrations increased to 40% for Latinos, and 56% for African Americans.
—
Editor’s note: Restores dropped text and tables. Elections analyst Paul Mitchell, a regular contributor to Capitol Weekly, is the creator of the CA120 column, vice president of Political Data and owner of Redistricting Partners, a political strategy firm.
Want to see more stories like this? Sign up for The Roundup, the free daily newsletter about California politics from the editors of Capitol Weekly. Stay up to date on the news you need to know.
Sign up below, then look for a confirmation email in your inbox.

Leave a Reply