Podcast
CA120: A strong voter turnout? Maybe
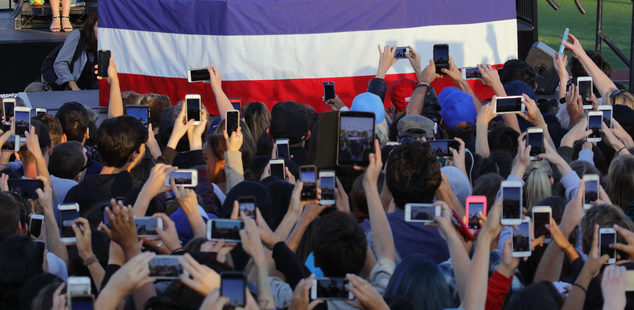 Attendees at a 2016 political rally in Santa Monica. (Photo: Joseph Sohm)
The 2018 primary election is right around the corner.
And with stories of higher turnout and a Democratic wave in states like Virginia and Alabama, many political consultants and observers are expecting to see some higher turnout in California this June, with a potentially strong Democratic and Latino surge.
It is easy to see how this is becoming common wisdom. There are more candidates running for competitive congressional seats than ever before. Fundraising has been through the roof. The diversity on the ballot, with strong Latino and Asian candidates in every statewide contest, could excite traditionally lower-turnout voters.
And the election cycle seems to be getting more media attention than any past gubernatorial election since 1998 when Gray Davis, Al Checchi and Jane Harman were battling it out.
But the fundamentals still aren’t entirely there.
Nearly a year ago in this column we looked at the likely turnout in the primary and general elections. These calculations were done before a series of special elections to fill the vacancies in the 34th Congressional, 51st Assembly district, the L.A. mayor’s race, and dozens of local elections throughout the state.
And, the low turnout in all of these contests appears to reinforce the idea that California voters just aren’t connecting the dots between their apparent frustration at the national direction and discourse and the act of mailing in a ballot or going to the polls on Election Day.
However, there is a glimmer of hope.
We at Political Data have just updated files from all 58 counties and there are relatively high registration trends from the past 12 months that could be a sign of an increased interest in voting.
Overall, the total number of registrations processed by California counties is at 1,815,182, more than double the 875,763 average for the past three gubernatorial election cycles. It is surprisingly higher than the 1,056,224 in the year prior to the 2016 election.
Looking at it quarterly and comparing it to the most similar last three gubernatorial cycles, the greatest growth appears to have come over the summer, with a bit of a drop in the holiday-dominated late fall and winter.
Pre-Gubernatorial Registrations by Quarter
| Prior Average | Pre-2018 | Increase | |
| Q1 (Jan-Mar) | 161,517 | 381,043 | 136% |
| Q2 (Apr -Jun) | 186,463 | 482,094 | 159% |
| Q3 (Jul – Sep) | 241,187 | 540,809 | 124% |
| Q4 (Oct-Dec) | 286,597 | 411,236 | 43% |
| TOTAL | 875,763 | 1,815,182 | 107% |
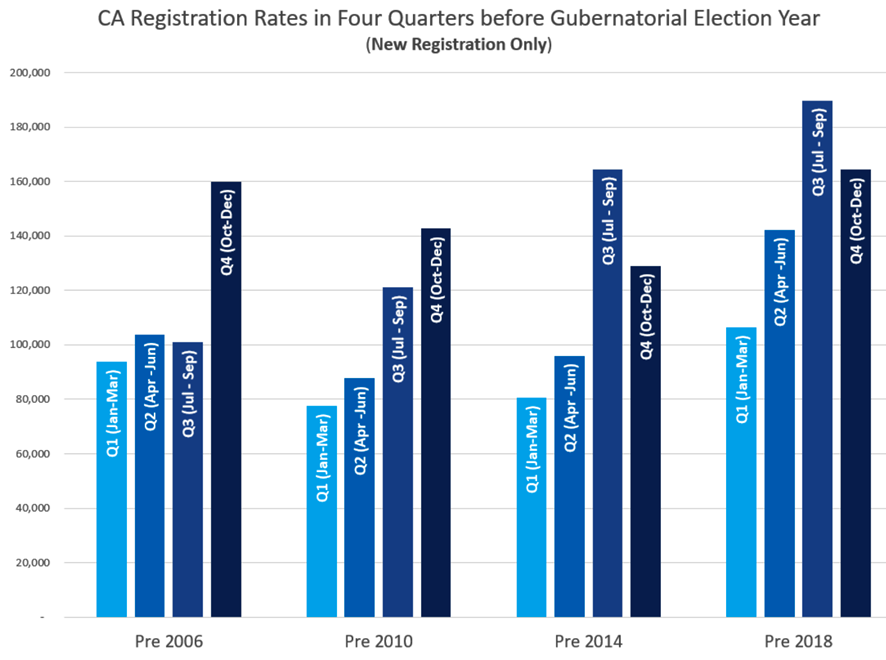
A part of this could be the relative ease with which voters can now register online. However, as the chart below shows, online registration didn’t do much for the pre-2014 cycle, even though by then more than a million voters had registered to vote using the system.
And this also cannot be attributed to changes in the Motor Voter law, since the most dramatic changes that became law in 2016 aren’t even going to be implemented until April 2018 at the earliest.
Within this population of registrations is a subset that are re-registrants, meaning they have a prior vote history and had to re-register because of a change in address, legal name or political party. When we take these re-registrants out of the formula we see a slightly smaller surge. Growth over the average of the past three pre-gubernatorial election years is 33%.
Pre-Gubernatorial New Registrants by Quarter
| Prior Average | Pre-2018 | Increase | |
| Q1 (Jan-Mar) | 83,929 | 106,287 | 27% |
| Q2 (Apr -Jun) | 95,774 | 142,267 | 49% |
| Q3 (Jul – Sep) | 128,820 | 189,752 | 47% |
| Q4 (Oct-Dec) | 143,835 | 164,308 | 14% |
| TOTAL | 452,359 | 602,614 | 33% |
In a recent Capitol Weekly survey of California voters who recently registered to vote, we found a few significant differences between these two populations.
For example, 55% of voters who are new registrants cited as one of the reasons for registering “Motivated by national Issues, Donald Trump, Congress” where this was a driving issue for only 42% of re-registrants.
More re-registrants characterized their motivation as “just completing paperwork, general interest in voting.” When asked to give a single word to describe why they re-registered, the most common were “Duty,” “Vote” and “Responsibility.”
For new registrants, the top terms to describe their motivation were “Citizenship,” “Duty” and “Trump.”
One could jump at this citizenship response and wonder how much of this surge is attributable to new citizens registering in response to the national rhetoric around immigration. The rate has been a steady 15% for 2017, but that’s actually a bit down from the 21% in the pre-2014 wave and 25% in the pre-2010 wave.
For new registrants, 70% say they are likely to vote in the primary, with 78% saying they are likely to vote in the November General. This is significantly lower than the 84% and 90% respectively among voters who are re-registrants. (This aligns with survey work Capitol Weekly did with California-based polling firm EMC and presented in an article and podcast last year.)
What does it mean?
This registration surge likely is the first signal within the data that California could have a more engaged electorate than in 2014. Something is definitely roiling below the surface and could present itself by June. However, the greater likelihood is that this wave actually stays fairly tame through the spring and summer months, and takes hold come November when these voters are already signaling an increased interest in voting.
In the year prior to the 2016 primary election we saw a big wave of new and re-registrants were excited for the election and turned out at rates even with those who were long-time registrants with prior voting history.
However, while those who register before presidential elections are typically enthusiastic and focused on voting, the same can’t be said historically for those who register before gubernatorial elections. Those who registered in the year before the 2014 primary election were just 19% turnout, compared with 25% total turnout. In 2010, with 32% total turnout, the pre-2010 registrants were at 25% and new registrants were at just 15%.
As we get into the actual election there should be special emphasis on these voters and review of the absentee ballot turn-in rates in the first weeks. By mid-May we should have enough data to determine if these voters are in fact participating in the June primary, or just waiting for the real fireworks in November.
—
Ed’s Note: Paul Mitchell, a regular contributor to Capitol Weekly, is the creator of the CA120 column, vice president of Political Data and owner of Redistricting Partners, a political strategy firm.
Want to see more stories like this? Sign up for The Roundup, the free daily newsletter about California politics from the editors of Capitol Weekly. Stay up to date on the news you need to know.
Sign up below, then look for a confirmation email in your inbox.
Leave a Reply