News
A rise in voters who shun party affiliation
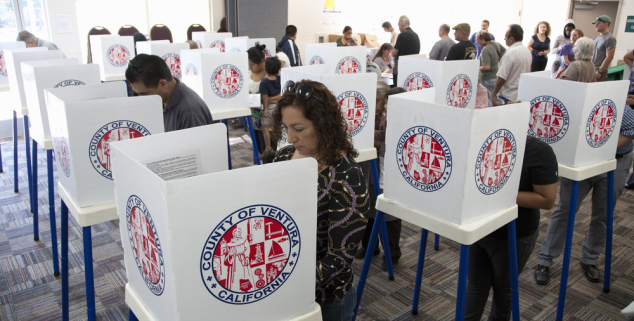 Voters in Ventura County cast ballots during a recent election. (Photo: Spirit of America, Shutterstock)
Increasingly, California voters are giving a thumbs down to both major parties when they register to vote, with those who decline to state a party affiliation now comprising nearly a fourth of the electorate.
Some 23.1 percent of California’s 17.63 million registered voters declined to state a party preference, up nearly 3 percentage points from 2010, according to figures released by the secretary of state’s office. The numbers were contained in the state’s official Sept. 5 registration report 60 days before the Nov. 4 general election. Another report with updated numbers will be released 15 days out from Election Day.
The increase in the numbers of independent voters mirrors a decrease in the registration percentages of both Democrats and Republicans.
The increase in the numbers of voters who eschew a party affiliation continues a long-developing trend.
Between September 1998 and September 2014, the number of decline-to-state voters has gone up dramatically, from 12.6 percent in 1998 to 23.1 percent currently. In a separate report last month on voter preferences, the Public Policy Institute of California reported that the percentage of decline-to-state voters had doubled between the November 1994 general election and the June 2014 primary – from 10.3 percent to 21.2 percent.
The increase in the numbers of independent voters mirrors a decrease in the registration percentages of both Democrats and Republicans, the secretary of state reported. Republicans, however, have experienced a sharper decrease.
Democratic registration has fallen from 46.7 percent in September 1998 to 43.4 percent this month. Republican registration during the same period dropped from 35.6 percent to 28.2 percent. Those who register with minor parties – Peace and Freedom, Green, Americans Elect and Libertarian – are at 5.3 percent, a figure that has fluctuated slightly over the years.
Those independent voters who are likely to cast ballots lean toward the Democratic rather than the Republican Party – 42 percent to 30 percent – while 28 percent lean toward neither party, according to the PPIC report. Nearly four in 10 independent likely voters view themselves as ideologically in the middle of the road, some 29 percent see themselves as liberal and a third, 33 percent, view themselves as conservatives, the report noted.
The percentage of voters who identify themselves as members of an organized political party dropped from 79.1 percent in September 2010 to 76.1 percent currently, the latest secretary of state
Overall, 24.26 million people are eligible to vote in California, while 17.63 million have actually signed up – about 72.7 percent, a modest increase of 641,801 voters over September 2010, when 72.24 percent were registered.
Among California’s 58 counties, 27 have Democratic majorities and 31 have Republican majorities. San Francisco Alameda and Marin counties have highest registration percentages of Democrats, with 55.8, 55.7 and 54.3, respectively. Modoc, Lassen and Placer lead the Republian counties in registration percentages, with 49.6, 48 and 46.4, respectively.
Los Angeles County has 4.88 million registered voters, the largest amount of any county. Democrats there outnumber Republicans by more than 2-to-1, with 2.47 million Democrats and 1.01 million Republicans, according to the L.A. County Registrar of Voters.
Want to see more stories like this? Sign up for The Roundup, the free daily newsletter about California politics from the editors of Capitol Weekly. Stay up to date on the news you need to know.
Sign up below, then look for a confirmation email in your inbox.
[…] John Howard, Capitol Weekly […]
[…] To read entire story, click here. […]
[…] A rise in voters who shun party affiliation […]
[…] The increase in the numbers of independent voters mirrors a decrease in the registration percentages of both Democrats and Republicans, the secretary of state reported. Republicans, however, have experienced a sharper decrease. Read More > at Capitol Weekly […]
[…] November 1994 general election and the June 2014 primary – from 10.3 percent to 21.2 percent.”A rise in voters who shun party affiliation by John Howard, Capitol Weekly, […]
[…] But there’s still work to be done, especially in the area of voter registration. For yet another year, Republicans saw their voter registration numbers dwindle to just 28.2 percent. Republicans have watched their share of the electorate consistently decline from 35.6 percent in 1998, according to Capitol Weekly. […]
[…] But there’s still work to be done, especially in the area of voter registration. For yet another year, Republicans saw their voter registration numbers dwindle to just 28.2 percent. Republicans have watched their share of the electorate consistently decline from 35.6 percent in 1998, according to Capitol Weekly. […]
[…] But there’s still work to be done, especially in the area of voter registration. For yet another year, Republicans saw their voter registration numbers dwindle to just 28.2 percent. Republicans have watched their share of the electorate consistently decline from 35.6 percent in 1998, according to Capitol Weekly. […]
[…] But there’s still work to be done, especially in the area of voter registration. For yet another year, Republicans saw their voter registration numbers dwindle to just 28.2 percent. Republicans have watched their share of the electorate consistently decline from 35.6 percent in 1998, according to Capitol Weekly. […]