News
CA120: A close look at California’s foreign-born voters
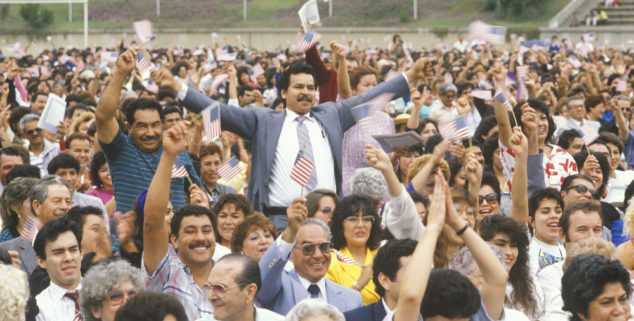 Latinos taking the Pledge of Allegiance in Los Angeles. (Photo: Joseph Sohm)
California is a diverse state, and this is reflected in the state’s growing voter file.
And to set the record straight, we are talking about full U.S. citizens, not some fictional “illegal” voters.
There are 3.8 million foreign-born voters on the California voter file, including 1.4 million born in Latin America, and each of these has had their eligibility verified by their county registrars, and by either the Social Security Administration, the California Department of Motor Vehicles, or with a valid state identification (generally a driver’s license) presented at their polling place the first time they vote.
Nearly 90% of foreign-born voters in California who participated in the 2016 presidential general election had already voted in an election prior to this year’s general election. The idea that county registrars (the majority of whom are Republicans in California) conspired to register millions of new illegal voters isn’t supported by one speck of the data — or a sliver of common sense.
So, what we have in California is a state with a rich population of foreign born voters who have been a significant part of the electorate for decades, as this interactive map shows.
U.S.-born and foreign-born voters have similar overall turnout patterns. However, as you dig deeper you can see a lot of variation.
In the 2016 general election, the U.S.-born population had a 2-point higher overall turnout rate, despite the fact that the median age of a foreign-born voter is 54 compared to 51 for a U.S.-born voter.
When we look at age groupings, we see that turnout rates are very similar, with a slightly higher performance from U.S.-born voters which improves as you get into the older populations.
| FOREIGN BORN | US BORN | |
| 18-24 | 54% | 59% |
| 25-34 | 61% | 63% |
| 35-54 | 71% | 72% |
| 55-64 | 75% | 79% |
| 65+ | 76% | 84% |
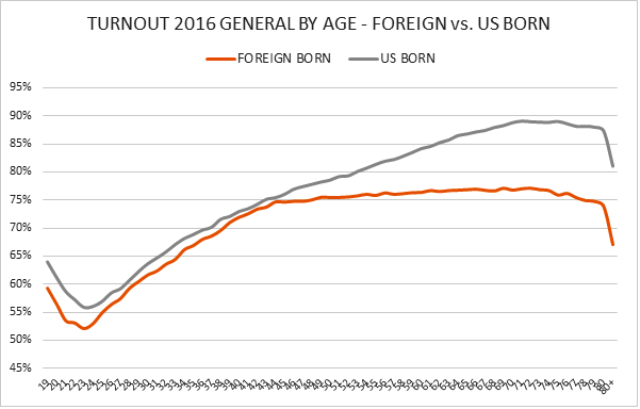
In a more detailed chart, showing age and turnout percentage, we see the comparative turnout rate for each year of age.
As we have seen in other turnout data, 18-year-olds turn out at a fairly high rate, then there is a drop for several years (moving to college, getting away from parents, etc…) and then a growth in voter turnout as they age. In this chart we also see that rates are fairly consistent through the mid-40s at which time the U.S.-born voters begin to increase in their turnout share by about a 10-point margin.
 We also have second and third generation voters who have combined with their parents to become significant voting blocs throughout the state.
Think of the Vietnamese population that helped elect Janet Nguyen to the state Senate from Orange County, the Armenian population that elected Paul Krekorian and Adrin Nazarian in Glendale and the San Fernando Valley, or the dozens of examples of Latino legislators who have come from both rural and urban communities with heavy Latino concentrations.
California is one part of the country where there is a notable “Latino” voting bloc, were voters from a number of Latin American countries act as a single ethnic voting bloc – with measurable voting patterns for candidates with Latino-sounding last names, regardless if they are from Mexico or the Dominican Republic, or elsewhere. Or, as in the case of Portuguese congressmen Jim Costa and David Valadao, they just have a Latino-sounding name.
However, among Asian populations, this does not appear as true. Where the last names of Nguyen, Chiang, Park, and Nakano all might sound “Asian” to many political consultants, voters in their respective communities can easily identify the Vietnamese, Chinese, Korean and Japanese nationalities of each.
Voting patterns appear to differ significantly among foreign-born voters and those second and third generation members of their communities.
One example: Vietnamese voters in Orange County have been consistently Republican, and this is true for foreign-born Vietnamese who are 13-points more Republican. But among U.S.-born Vietnamese, this flips to a 20-point Democratic advantage. The data also shows that racially polarized voting among these populations is strongest among first-generation voters, and dissipates as voters get into third and fourth generations where the factors of ethnicity and national heritage are more diluted.
Looking closely at the data, there are inflection points at which an ethnic population goes from being more heavily foreign born to younger second and third generation voters. And this inflection point varies by ethnic group.
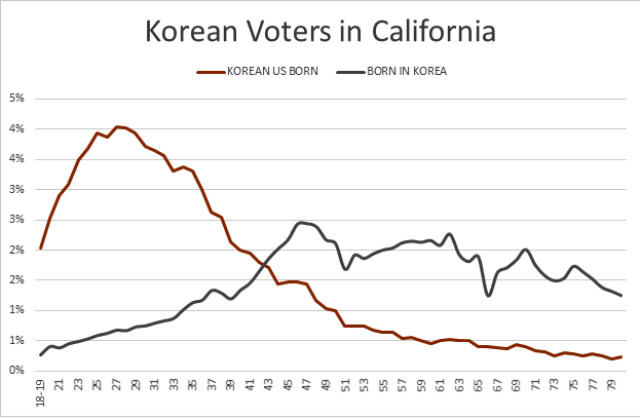
For example, the median age for a foreign-born Korean voter is 56, while the median age for a U.S.-born Korean voter is just 33.
Graphically, we can see these Korean populations on a spectrum from oldest to youngest, with the vertical axis showing their share of that age on the voter file. This not only gives detail on the size of the younger generations of Korean voters, but it also shows the inflection point, in this case the age of 43, where the community dramatically shifts from older foreign-born majorities to younger and U.S.-born.
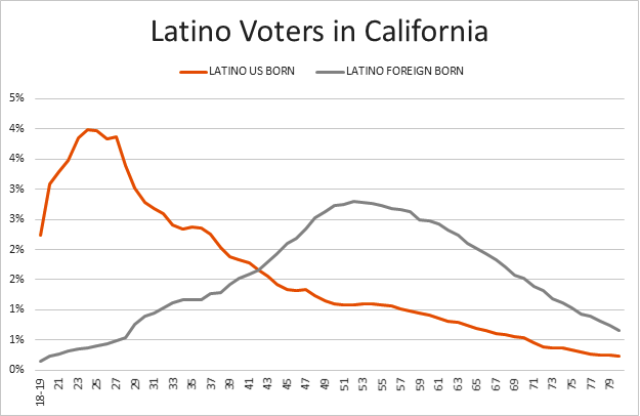
Looking at Latinos, we see much of the same pattern, with their inflection point at age 42.
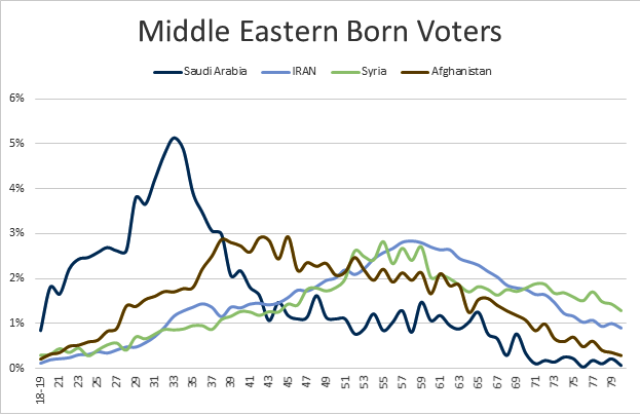
We can also use this data to look at a region of the world — like the chart below with selected Middle Eastern countries — to see the relative ages of their foreign born populations. In this chart, the median age of Iranian born voters is 57, while the median age of those born in Afghanistan is a younger 47. For those born in Saudi Arabia it is just 34. This is reflective of overall immigration policies and international events impacting these populations.
For many campaigns, the state’s ethnic enclaves present challenges. For those candidates within an ethnic group, each has their own internal distinctions, power bases, language media, and, often, quite a bit of infighting.
And for candidates not of that ethnicity, there are challenges in breaking through, gaining trust, and earning votes from a group with which they do not identify. Or, when a group has their own candidate, a tough balancing act of working to earn their vote, knowing that it is an uphill or impossible battle, and not letting pride get in the way of smart campaigning.
However, a sophisticated campaign in today’s California political world should have the tools and understanding of these ethnic populations to understand how their different nationalities, rates of foreign-born or U.S.-born, and relative ages of their populations, can impact messaging, targeting and voter turnout.
Not utilizing these tools and just treating every Asian voter or every Latino voter the same is not a strategy.
It is laziness.
—
Ed’s Note: Paul Mitchell, a regular contributor to Capitol Weekly, is the founder of the CA120 column and the vice president of Political Data, which markets information to campaigns in both major parties.
Want to see more stories like this? Sign up for The Roundup, the free daily newsletter about California politics from the editors of Capitol Weekly. Stay up to date on the news you need to know.
Sign up below, then look for a confirmation email in your inbox.
Any immigrant is welcome in California and the United States—as long as they
followed the law.
Unfortunately there are those trolling for votes -who will give their middle finger to
the law–and allow people to sneak in.
Indeed a Long Beach City Council Meeting—IN DIRECT VIOLATION OF THE
BROWN ACT–some tried to push thru a measure to have Long Beach a
SANCUTARY CITY.
Indeed, the Vice Mayor–said those who opined people should not be allowed
to CUT in Line…the Vice Mayor opined that was manifesting a PRIVLIDGE
MINDSET !!!!