Analysis
CA120: North versus South in 2018 primary
 Balancing the political power between L.A. and the San Francisco Bay Area. (Illustration: Tim Foster, Capitol Weekly)
With five months to the 2018 gubernatorial primary election, there is a natural tendency to try and find the single major factor that will determine the outcome.
Will it be Donald Trump, absentee voters, young people, the gas tax, racially polarized voting, the open primary, North versus South, the growing number of independent voters, the new registrants since President Trump was elected, or 25% of the electorate who registered to vote in 2016?
The fact is, it will be all of these things.
Yet, among these, one of the pieces of reporting that caught our eye last week was an excellent story in the LA Times (extra points for cool maps) which declared “California governor’s race is likely to be decided in Los Angeles County.”
The latest polling in the gubernatorial race shows Republicans slipping outside the top-two in the primary, with Democrats Gavin Newsom and Antonio Villaraigosa topping the field. For these two candidates, the contest does appear strongly geographic, with Villaraigosa doing better in Los Angeles and Newsom having a strong grip in the Bay Area.
There are admittedly ideological and policy divides between the two campaigns – but these are muddied, largely because of ethnicity.
While Sacramento’s political class and policy experts consider Newsom the liberal and Villaraigosa more conservative, among voters that is actually flipped. It is as if voters cannot get their heads around the idea that a Latino from Los Angeles would be more moderate than a white, business-owner lieutenant governor, even if he is from San Francisco.
The geographic divide is striking, and has been a factor in statewide elections for decades. That’s particularly true over the past several election cycles, when the Bay Area took great strides toward voting by mail, while L.A. County, under a previous registrar of voters, pushed against the increase in permanent absentee voting.
Looking at voter registrations, Los Angeles County has a much greater electoral strength than the Bay Area (defined as the counties of San Francisco, San Mateo, Santa Clara, Alameda, Contra Costa, Sonoma, Marin, Napa and Solano).
Come election day, however, history shows that this power flips.

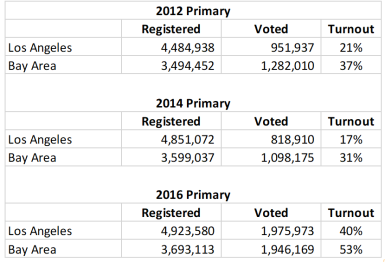
In the 2012 Primary, L.A. County had one million more voters than the Bay Area, but the Bay Area generated 330,000 more votes cast.
In percentage terms, L.A. County’s voter file was 22% larger than the Bay Area — yet the Bay Area accounted for 35% more votes. This was driven by a turnout disparity of 16-points, with Bay Area voters at 37% turnout and L.A. at just 21%.
In the 2014 gubernatorial election this was an even larger flip. While the raw numbers were lower, Los Angeles County went from being 26% larger in registration to 35% lower in actual votes cast.
In 2016, L.A. County finally caught the Bay Area in total votes cast, but this was still a 13-point turnout drubbing, with L.A. Voters walking into the election with a 1.2 million voter advantage, and walking out of the election with a tiny 30,000 vote advantage over the Bay Area.
Put in another context, if Los Angeles County had voted at the same rate as the Bay Area in any of these three past primary elections, they would have accounted for between 615,000 and 700,000 votes in each election.
This is something that the Los Angeles-based candidates will obviously want to rectify in order to have a better shot in June.
The other factor correlated with geography is obviously race.
Los Angeles registration is 30% Latino and contains 37% of the state’s Latino voters. The Bay Area, by comparison, is only 11% Latino and has almost 100,000 more Asians than Latinos.
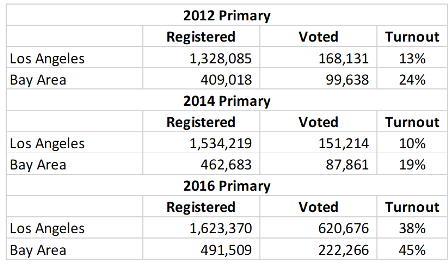
Latino turnout has been historically very low in primary elections, particularly in gubernatorial cycles. In 2014, Latinos in Los Angeles County turned out at just 10%, while in San Francisco it was only 19%. 
A part of the historic Latino voter under-performance has to do with the average age of the Latino population in California. If you look at the average nursing home, the population is predominantly white, but check the average hospital nursery and you will see a much different incoming population. Births, school-age children, and even those entering legal voting age are majority Latino.
In Los Angeles, turnout among 18-34 year olds in the 2014 primary was just 5% and it was only 11% in the Bay Area. A whopping 1.25 million voters under 34 sat out the 2014 Primary in Los Angeles County, compared to 700,000 in the entire Bay Area.
A big effort to change in these numbers, such as that being discussed by billionaire political activist Tom Steyer, could impact the gubernatorial race significantly and could buoy Latino turnout. And Los Angeles County, with over 30% of the non-voting young people in the state, would benefit even more.
It is also important to note that the governor’s race isn’t happening in a vacuum. There is a high profile U.S. Senate race with Kevin De Leon trying to energize the same voters, and any strategy that helps Villaraigosa could also benefit his campaign.
In local contests, we have seen an increase in white polarized voting against ethnic candidates as the number of ethnic candidates on the ballot increased.
In the book Ethnic Cues, author Matt Barreto identified a pattern of increased turnout among minority voters when candidates from their community are on the ballot and perceived as strong candidates. And with prominent Latinos in six of the eight contests, Asians in three, and one race with an African American, this election would seemingly qualify as one with this potential.
Two of the candidates on the ballot, Villaraigosa and De Leon, can actually lay claim to some of the highest rates of Latino over-performance in the state with their 2005 and 2006 elections, respectively.
In those races Latinos turned out at a rate higher than non-Latino voters – a result that has not been seen in more than a thousand races that I analyzed going back nearly 20 years.
But there is also a potential counter-balance to increased Latino or Asian voting – polarized white votes. Remember, even with our growing state diversity and the fact that Latinos are the largest share of the California population, more than 60% of the electorate in the 2018 Primary is projected to be white.
In local contests around the state, be they in Garden Grove, San Jose, Glendale, or other communities, we have seen an increase in white polarized voting against ethnic candidates as the number of ethnic candidates on the ballot increased.
Winning candidates are often successful when they can break out of these boxes of geography, ethnicity or their perceived base.
This has often out-swamped the higher ethnic turnout that also comes with increased minority candidates on the ballot. It is not something California should be proud of, but it is something that campaigns need to be aware of and work to overcome.
Yet, with all these numbers, and the ease with which we seem to put these labels on the race, there’s a counter-intuitive lesson to all that is embedded in past election results.
The fact is, winning candidates are often successful when they can break out of these boxes of geography, ethnicity or their perceived base, and win by effectively connecting with voters.
Current Secretary of State Alex Padilla is one example.
In the 2014 primary, Padilla was a state senator from the San Fernando Valley and former Los Angeles City Council president. As a Latino with a Los Angeles base, few would be surprised to hear that he won L.A. County handily with 39% of the vote.
But, despite all our attempts to reduce the electorate to its ethic and geographic component pieces, he somehow won San Francisco by even more, exceeding 40% in a county where the Latino vote only reached 8% and his name recognition before the election was probably even lower.
In the earlier 2010 election we also saw statewide candidates who were defined by candidates who overcame these factors.
Then-San Francisco City Attorney Kamala Harris won the race for state attorney general in San Francisco in dominating fashion, as could be expected given the fact she had won city wide twice.
But Harris, elected to the U.S. Senate last year, really sealed her victory by beating the city attorney of Los Angeles, Rocky Delgadillo, in L.A. County by 10-points, 30% to 20%, with Ted Lieu and Chris Kelly absorbing much of the remaining votes.
Similarly, in that 2010 election, Sacramento-based Assemblyman Dave Jones won in the Bay Area by a nearly 70%-to-30% margin, but his real dominance in the race came when he narrowly beat Los Angeles based Assemblyman Hector de la Torre in Los Angeles, 52% to 48%.
So, by June this year we might find that our prognostications about the race being defined by geography or ethnicity, Trump, the impact of new voters, the growing rate of Independent registration, or other factors comes true.
Or, potentially, the victors in each of these contests will be those who can break out of these boxes and build an electoral coalition that isn’t simply defined by the constraints that the media and political common wisdom place on them.
—
Ed’s Note: Paul Mitchell, a regular contributor to Capitol Weekly, is the creator of the CA120 column, vice president of Political Data and owner of Redistricting Partners, a political strategy firm.
Want to see more stories like this? Sign up for The Roundup, the free daily newsletter about California politics from the editors of Capitol Weekly. Stay up to date on the news you need to know.
Sign up below, then look for a confirmation email in your inbox.

Mitchell’s superb voter analysis here needs to be posted on bulletin boards of every college poly sci course and campaign headquarters statewide … and read out loud by staffers at least once a week until the June primary election.