News
CA120: Land lines and cell phones and data, Oh My!
 Telephone poles with their land-line wires fade into the sunset of a California highway. (Photo: Ethan Daniels.)
For the past year, we have been witnessing a rapid shift in political polling.
Because the best polling is generally done for private clients, the changes aren’t always discussed in a public forum.
But an interesting new study released recently by frequent CA120 contributor Jonathan Brown of Sextant Strategies & Research, along with the work I am doing with other pollsters in the state, shows that we are in the midst of important changes in the industry.
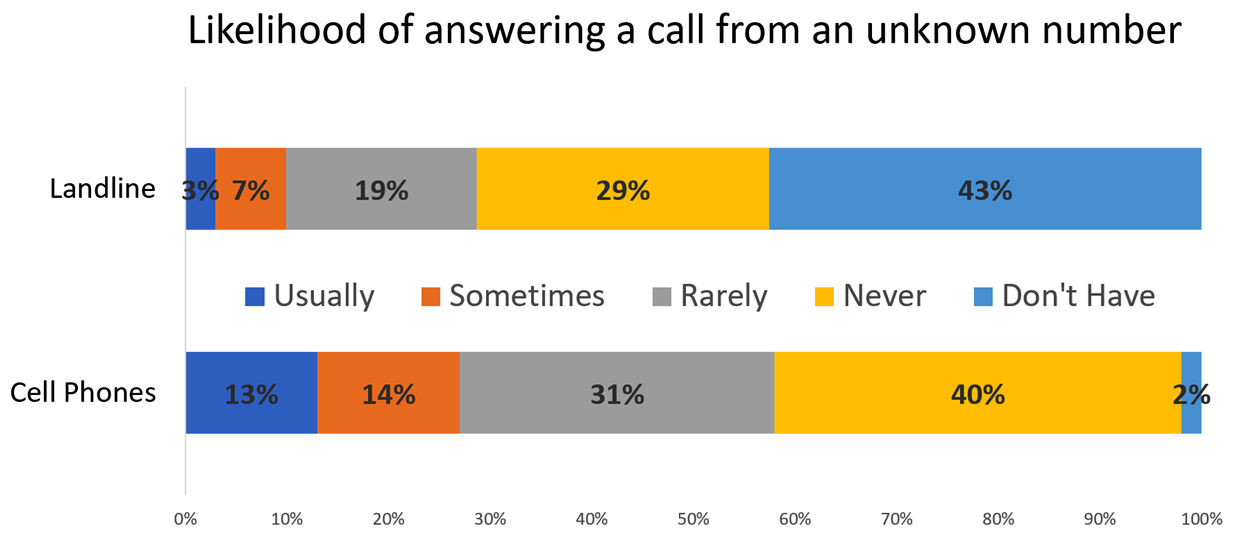
Recent research indicates that people are more likely to answer a phone call from an unfamiliar number on their cell phones than on land lines.
For decades, polling relied on a strong pool of easily reached voters with a traditional land-line telephone. Before caller-ID became prevalent, nearly every call was answered as long as someone was home.
But now more voters are untethered from traditional phones (I haven’t had a land line since 1998), and those who do still have them complain that most incoming calls are from telemarketers.
In response to the reduced use of land lines, Pew Research in 2007 started calling cell phones. At that time only 5% of voters were living in households with only wireless service. That number has since grown to 47%, and Pew has increased its cell-phone percentage of public research surveys from 20% to more than 75% wireless.
In political polling, the split between interviews completed by land line and by cell phone is also trending more toward the latter. And this is not just about the lack of land lines.
Potential respondents keep cell phones with them around the clock and recent research indicates that people are more likely to answer a phone call from an unfamiliar number on their cell phones than on land lines.
As shown below, in Brown’s study of likely 2018 general election voters in Orange County, he found that only 3% of Internet poll respondents said they “usually” answered calls on their land lines from unfamiliar numbers (e.g. pollsters), while 40% had no land line. For cell phones, only 13% “usually” answer the unknown call. Brown’s study methodology combined Internet and phones.
In political polling, our universe of actually reachable phone respondents for polling is quite low.
With nearly 20 million registered voters in California, we have cell phone numbers for only 30% (5,895,547). We have land-line numbers for 42% (8,113,033), but those calls increasingly go unanswered. The overlap is minimal — the file includes both land line and cell numbers for fewer than 5% of registered voters.
But in the last few years, more attention has been paid to email and the increasing availability of emails in California that are tied to the voter file.
The latest count from Political Data shows the voter file has the email addresses of 35%, or nearly 7 million, of all registered voters – almost one million more voters than those for whom we have cell numbers. This total increased rapidly with the surge in activity last year, particularly among those who used the online system to either register for the first time or update their voter registration.
The following chart shows how phone and email availability has changed over time. Since 2013, voters have been more likely to have a cell phone than a land line. And where more than 70% of voters registered before 1985 have land lines, that drops to just 20% for voters who registered in 2016. (Some earlier registrants have cells and emails because their registration was updated without being considered a full re-registration, or appended with commercial data.)
Because cell phones and emails have a disproportionate number of those new registrants (though in many cases, these are longer-term registrants who updated their registration information), there have been questions about how representative these universes would be of voters overall in polling.
One pollster I worked with in the 2016 cycle had a quota of 40% cell-phone respondents, and he was shocked to learn that a whopping 23% of his voters were new registrants — a rate about 3 times the natural share of the electorate that reflected new registrants at that time.
This was because pollsters often account for age, but don’t specifically weight or analyze the voters they are reaching based on the recency of their registration, creating a hidden bias within the over-sized cell phone sample.
Phone respondents were more likely to say “don’t know,” than Internet respondents, which is commonly observed in these comparisons.
In Brown’s demonstration project, he ran concurrent studies of likely 2018 general election voters in Orange County with 400 phone respondents and 333 Internet respondents.
Each of these samples, along with a combined total sample, were weighted identically to the demographics of the actual likely voter universe, accounting for age, gender, ethnicity, partisanship and registration dates. By doing the sample and weighting with these factors, for most questions the results were within a few points of each other.
“These Internet results indicate that a combined approach enhances our reach into the electorate and can provide polling consumers with larger samples in a cost-effective way,” Brown said.
Respondents were asked whether they approved or disapproved of President Trump’s job performance on several issues. The results are below, ranked by the difference in net result by sample.
Approve Disapprove
The economy (phone) 49% 40% +9
(Internet) 52% 42% +10
Health care (phone) 39% 51% -12
(Internet) 39% 55% -14
Bringing jobs back (phone) 57% 31% +16
(Internet) 57% 33% +14
Immigration (phone) 45% 51% -6
(Internet) 48% 51% -3
Foreign policy (phone) 44% 46% -2
(Internet) 43% 52% -9
The fight against ISIS (phone) 55% 32% +23
(Internet) 52% 39% +13
The environment (phone) 36% 49% -13
(Internet) 33% 58% -25
“Democrats on the Internet were more extreme than those we reached on the phone in terms of opposition to Trump or Republicans.” — Jonathan Brown
The differences in approval are very close on each item while there is more variation in the disapproval. There are several possible explanations.
Phone respondents were more likely to say “don’t know,” than Internet respondents, which is commonly observed in these comparisons. We can infer that some of those phone respondents were reluctant to give an anti-Trump answer to a phone respondent. Also, the Internet sample had more college educated (and especially post-graduate) respondents, were higher-than-average in saying they were “extremely interested” in the upcoming elections and in finding the country “on the wrong track.” It’s also important to see that many of the subsamples are very similar across phones and Internet.
“Democrats on the Internet were more extreme than those we reached on the phone in terms of opposition to Trump or Republicans,” Brown noted. “But the responses among Republicans and NPP voters were pretty consistent regardless of how we gathered the data.”
To see more of the survey, visit his results here: http://www.sextant-research.com/sextant-conducts-groundbreaking-multi-modal-ca-political-survey-comparison/
Brown believes that the similarities and differences in results speak well of a hybrid polling methodology including both phones and emails.
In most states, the availability of good voter data is a challenge.
“I believe that few of our Internet respondents would have been available to us by phone, so a combination is more representative than either in isolation,” he said. “The challenge is in understanding how to combine the samples.”
And he isn’t alone in this concept.
Several other pollsters I work with are looking to create new methodologies which combine emails and phone respondents to increase quality, reduce costs, and allow them to get large numbers of completes in a shorter period of time.
However, while this is a strong trend in California polling, don’t expect to see this employed everywhere in the country.
In most states, the availability of good voter data is a challenge, and lack of voter file emails in most states means that national pollsters cannot justify building the systems to incorporate email-driven polling samples into their regular body of work.
Instead, national polling will likely remain driven by phone surveys. And when they talk about “Internet polling” they will be referring to the lower-quality panels of pre-selected online respondents who take surveys for gift cards or financial reimbursement.
And, in these cases, partisan registration and history of turnout is provided by the respondent, who probably knows being unregistered or unlikely to vote means they won’t be able to take the survey. This bias means that you are often getting in panels a non-representative survey.
The industry is changing, and voter file driven online surveys are a part of it. Watch in 2018 for an increased prevalence of these surveys and potentially a growing reliance on mixed-mode surveys that take advantage of home, cell and online respondents.
—
Ed’s Note: Paul Mitchell, a veteran political strategist and a regular contributor to Capitol Weekly, is the founder of the CA120 column and the vice president of Political Data, which markets information to campaigns in both major parties.
Want to see more stories like this? Sign up for The Roundup, the free daily newsletter about California politics from the editors of Capitol Weekly. Stay up to date on the news you need to know.
Sign up below, then look for a confirmation email in your inbox.

Leave a Reply