News
CA120: Behold the real numbers of California’s 2018 election
 An illustration suggesting the variations in the voting population. (Image: Julian Tromeur, via Shutterstock)
There are plenty of things to look at now that California counties have updated their voter files with the 2018 general election vote history. This is our first chance to see what really happened, as opposed to what people thought had happened based on the outcomes.
There are several potential themes in the 2018 general election data, but the following are some of the toplines that can be helpful in understanding what happened — and what might be coming next, with the 2020 election cycle right around the corner.![]()
—Turnout was high, but not presidential level high. At 65%, the electorate was about 10 points higher than we have seen in recent similar gubernatorial elections, but still about 12 points lower than what we expect to see in 2020.
—The partisanship of the electorate was a key factor in the outcomes. It will surprise many that despite higher raw Democratic votes, the Democratic share of the votes cast was the same as it has been in similar elections going back to 2002. What changed significantly was a spike in non-partisan voting to a record high, and a drop in the Republican share of the votes cast to a record low.
–The electorate was significantly more Latino than we have seen in similar elections. In raw numbers, Latinos exceeded many expectations. Over 2.6 million Latinos voted, more than double the 1.1 million that voted in 2014, and among Latinos aged 18-34, there was a 400% increase, from 214,000 in 2014 to 838,000 in 2018. All that said, Latinos were still under-performing relative to their rate of registration. Statewide, 21% of votes cast came from Latinos, compared to the 26% share of the voter file that was Latino.
–-Age was a significant factor. Turnout by voters aged 18-24 grew 30 points, from 16% in 2014 to 46% in 2018. Among those 25-34, it grew by 33-points, from 17% to 50%. The raw numbers are staggering: In 2014, only 282,000 voters aged 18-24 voted, while in 2018 it was 948,000 – more than tripling the total votes by this traditionally low-turnout population.
Total Turnout
After the 2018 primary election, there was a lot of over-the-top excitement about the higher turnout. Yet it ended up being just 37%, not a massive increase compared to two of the last three gubernatorial primaries, at 35%.
After the general election, we saw much of the same excitement about record turnout. In the general, the turnout rate was significantly higher than past mid-term elections at 65%, without any other recent similar elections reaching 60%. But that’s still within the family of gubernatorial-level turnout.
When you look at total turnout percentages in past elections, it helps to look at them in clusters of similar elections.
In the following chart you can see the lowest turnout elections, gubernatorial primaries hovering at mid-30s turnout, all the way up to the highest-turnout elections, the presidential generals all in the mid-70s.
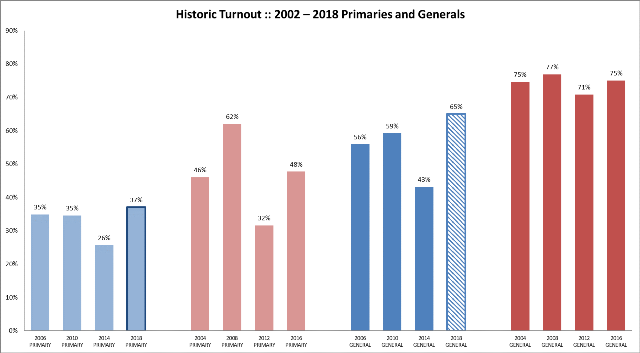
The 2018 primary and general elections are highlighted, and they seem to fit with other similar elections. Looking at this data one wouldn’t think the 65% turnout election was a presidential general or a primary election. It is clearly within the family of other gubernatorial general elections.
This, of course, is based on a percentage – the total votes cast divided by registration. And that denominator, the registration, is dramatically increasing, particularly with the new version of the DMV’s voter registration procedures and the wide use of online voter registration.
Looking at the raw number of votes cast, we can see a whopping 12.5 million ballots, much higher than past gubernatorial elections. In fact, total voter participation was more than 5 million more than 2014 and just a half-million fewer than the number of votes cast in the 2012 General. 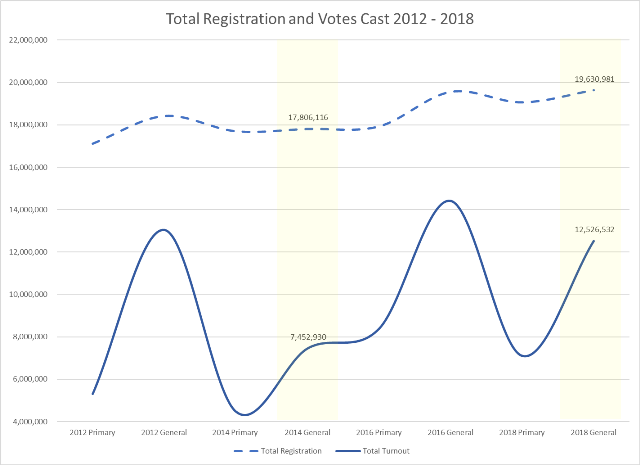
As the voter file continues to grow, likely reaching 20 million in the coming months and potentially reaching 22 million in 2020 or 24 million by 2022, we may have to revisit how we compare election cycles. For example, the turnout percentage could be less informative, because a 70% turnout in 2022 could actually be lower than the 77% in 2008, but still be millions of more actual voters.
California Partisan Turnout
Gubernatorial elections usually favor Republicans as they have more older, consistent voters. And in 2018, partisan turnout was still strongest among Republicans, with 71% of all registered Republicans casting ballots. This is 20 points higher than the 2014 General, and just 4 points shy of 2012 Presidential turnout.
However, there are fewer Republicans now, so while Republicans had high turnout, their percentage advantage over Democrats was actually cut in half from 2014. Democrats grew their turnout rate from 43% in 2014 to 67% – a 22-point gain. Those not aligned with either major political party (no-party preference, American Independent, other minor parties) also grew their turnout by 22-points, from just 32% to 54%. 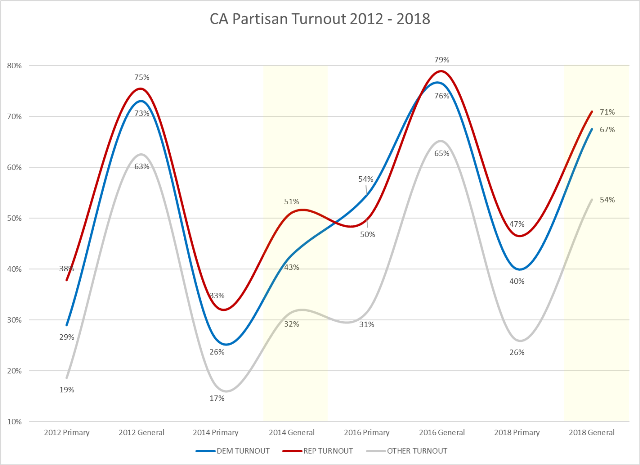
Turnout rates are an important measure, but what wins elections is a combination of the turnout rate, and how large that group is as a segment of the electorate to begin with. This is the “share” of the electorate that casts ballots in a given election. Under this metric, the real story of partisanship in the 2018 General Election can be seen.
Democrats and Republicans overperformed their registration share, which is consistent with past elections, while nonpartisan voters underperformed. However, the improved performance of nonpartisan voters meant that for the first time ever, those not registered with either major political party were a larger share of the votes cast than Republicans. 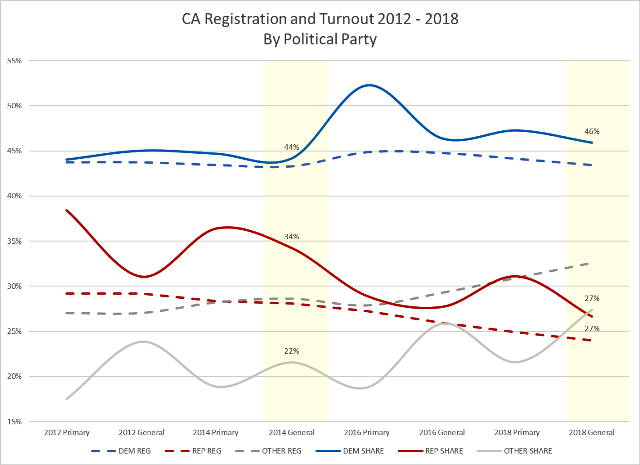
Looking back further, one can see how significant the erosion of the Republican vote has been in California. In the 2002 gubernatorial general election, Democratic voters accounted for 46% of the votes cast, exactly where they were in 2018. But Republicans’ share of the electorate dropped from 40% to 27%, while nonpartisan voters grew from 15% to 27%. 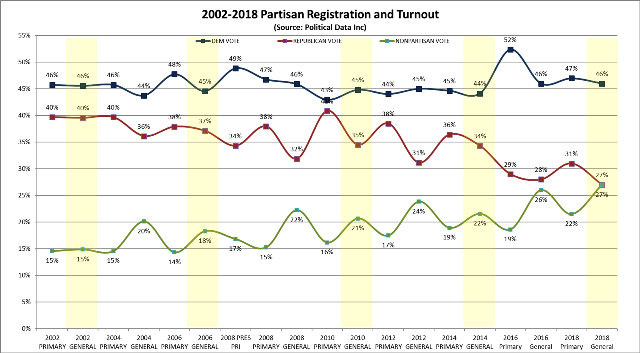
Age turnout
Age was a significant factor in the composition of the electorate in the 2018 General. The changes in voter registration significantly increased the number of 18-24 year-olds, from 1.8 million in 2016, to just over 2 million. Multiplying their impact, turnout of 18-24 year-olds grew 30-points, from 16% to 46%.
The raw numbers are staggering – in 2014 only 282,000 18-24 year-old’s voted, in 2018 it was 948,000 – more than tripling the total votes by this traditionally low-turnout population. The same kind of growth occurred with 25-34 year-olds. And, yet, these spikes in both registration and turnout are less than what we would expect to see in the 2020 general – an ominous warning for campaigns that have not been able to appeal to the youth vote. 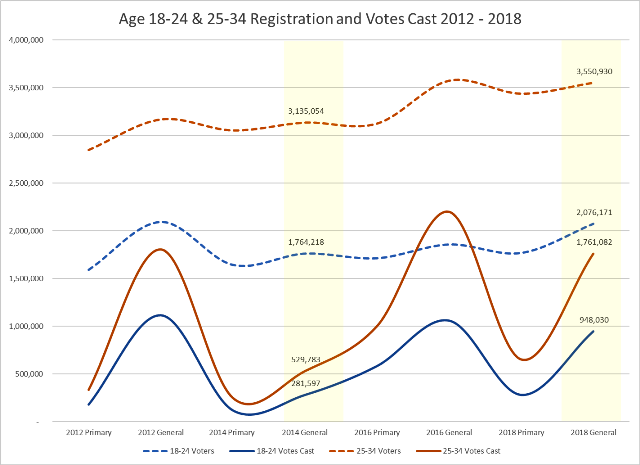
In comparison of percentage turnout by age groups, 25-34 year old’s grew their turnout rate by 32-points, from 17% to 50%, while among seniors the increase was only 13%, albeit seniors were starting as the highest turnout population, so they had less room to grow. 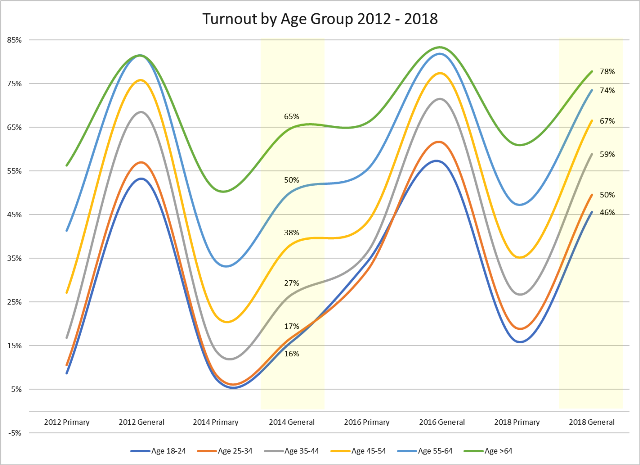
In an interesting mix of age and partisanship, younger Democrats outperformed younger Republicans, a departure from the 2014 election where Republicans outperformed among all age groups and more akin to what we would see in a presidential election. 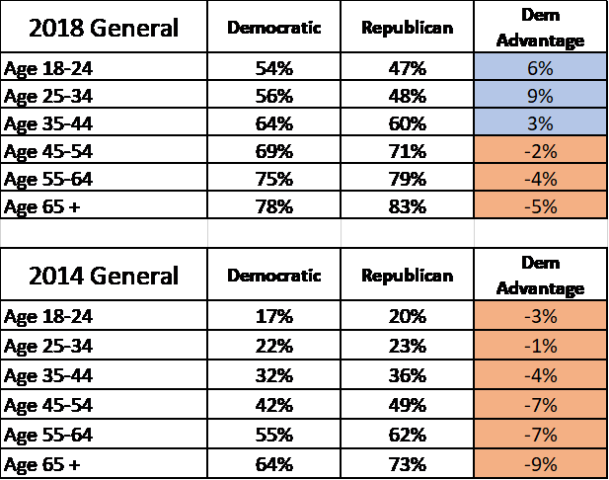
CA Latino and Asian Turnout
The 2018 election gave Latino and Asian voters a lot of reasons to turnout. At the national level, an anti-immigrant push by President Trump, including the hyperbolic attacks on migrants at the southern border, contributed to a polarized national tone, one that has historically resulted in higher Latino and Asian participation. In addition, the 2018 elections had the most minority candidates ever seen on a California ballot – the primary shattered previous records, and the general also had a record number of candidates, including minority candidates in all races except for governor.
Latino registration broke the 5 million mark in 2016 and held that through the 2018 cycle. 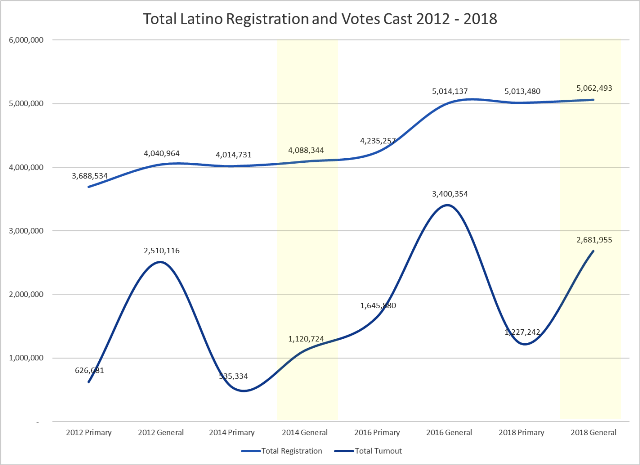
In terms of turnout percentages, Latinos grew to 26% of all registered voters. As a share of who voted, they were at 21% — highest ever for a gubernatorial general election. 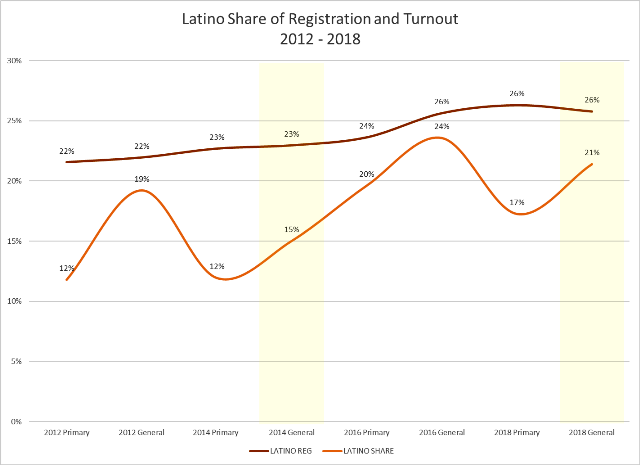
Interestingly, Latino turnout was higher than Asian turnout in the 2016 primary and general, but not in 2018. Maybe having Trump on the ballot is more important to driving Latino turnout than the large number of Latinos candidates who were on the ballot, and won, statewide in 2018. 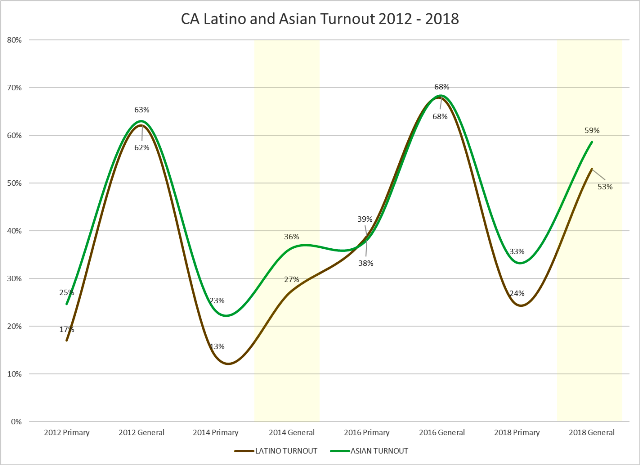
What does this mean for 2020?
Everything we saw in 2018 pointed to higher engagement from young voters, independents, Latinos, essentially propping up Democratic candidates beyond their base partisan turnout.
This is something that should be expected to grow in 2020 based on the turnout we generally see in presidential elections and how much more polarizing that election will be with President Donald Trump on the ballot.
With 2018 at 65% turnout, and a projected 75-79% turnout in 2020, we are looking at a 10-14 point increase. And this won’t come from older, whiter, conservative voters, it will come from the kind of voters that support Democrats and progressive causes.
The partisan leanings of the state’s voters will also be magnified by the impact of the state’s New Motor Voter law which has already processed 1.8 million registrations, a half-million of which had never voted in a California election before. We could see the voter file jump to 22 million voters with Millennials and Generation Y taking an even larger share of the voting population.
All this is to say that the initial “wave” election we just saw could be a precursor to a larger swell of voter turnout and engagement than we have seen in California, and potentially millions of voters in that election will come from people who haven’t participated in an election since the 2016 general or have never voted in an election at all.
The outcomes may not be as ground shaking, since Democrats in 2018 won just about every competitive race. But it could have a significant impact on a number of close districts, including state Senate districts that weren’t up in 2018 and any potential ballot measures that could strike out at venerable institutions, such as Proposition 13.
Nationally, if we see this kind of continuation of the 2018 wave, we could see a continued flipping of Congressional seats, gains in legislatures and governor’s offices before the pivotal 2021 redistricting, allowing Democrats to reshape the political map for the decade to come in much the same way that Republicans took 2010 gains to shape the national map for the last decade.
—
Editor’s Note: Paul Mitchell, a regular contributor to Capitol Weekly, is the creator of the CA120 column, vice president of Political Data and owner of Redistricting Partners, a political strategy firm.
Want to see more stories like this? Sign up for The Roundup, the free daily newsletter about California politics from the editors of Capitol Weekly. Stay up to date on the news you need to know.
Sign up below, then look for a confirmation email in your inbox.
Leave a Reply