News
CA120: Tracking the absentee vote tracker
 A street sign for voters. (Photo by Gustavo Frazao, via Shutterstock)
The 2016 General Absentee Vote Tracker, brought to you by Political Data and CA120, is up. And over two million voters have already returned their ballots.
This year, a great deal of national attention is being paid to the rate of early voting, and politicos from both sides of the partisan aisle are using this data to make predictions in the presidential, congressional and state contests. (To see the best collection of national early voting data, visit the US Election Project)
We have been tracking early voting for several election cycles in California, so we know that while the early data can be extremely useful, it is also prone to misinterpretation.
One example of early projections missing the mark was the general consensus around low primary turnout for Latinos and young voters. As can be seen in the Primary Election Tracker, in the initial calculations, 18-to-35 year olds only accounted for 10% of votes cast, and Latinos for 13%.
Yet, on Election Day, the combination of late absentees and poll votes, including a record high level of provisional ballots, saw a California electorate that was 24% Latino, and 25% aged 18-to-35.
Months later, the low projected turnout story line was so embedded in media coverage that even the most informed candidates and consultants would not have known that the June primary saw the highest share of Latino and millennial turnout in California’s history.
With that cautionary tale, we can take a look at the growth in early voting, and begin to understand what, if anything, this can tell us about what to expect for November.
Two Parts of the Early Vote Puzzle.
Increases in early voting can expose two types of election phenomena.
The first factor in early turnout is the change in election rules and how the administration of early voting is being carried out.
These are the mechanical pieces – such as how many people are registering to vote by mail, when the ballots are received and even if the ballots come pre-stamped. The latter happens when voters are forced to vote by mail (usually in rural areas), if a county has the budget to provide pre-paid envelopes (like in Santa Cruz and Santa Clara counties) or even if the county is just getting better at reporting the data.
The second factor is more a read of the psychology of voters. Are they enthusiastic? Do they just want to get this election over with? Are they procrastinating because they are stumped by the ballot measures?
Of these two factors, the first is likely the greatest, but almost all of the coverage falsely applies the voting patterns to the latter.
In California, the greatest structural change since the last presidential election has been the consistent shift to voting by mail.
In 2012, less than half of California’s registered voters were permanent absentee voters, or PAVs. Since then, two-thirds of registered voters have converted to PAV status. Among online registrants, this figure has reached 72%.
As a result, the number of vote-by-mail voters heading into this year’s election is much greater than in the last presidential election.
And this increase has not been uniform. Democrats, independents and Latinos have all see major growth in conversion to PAV status.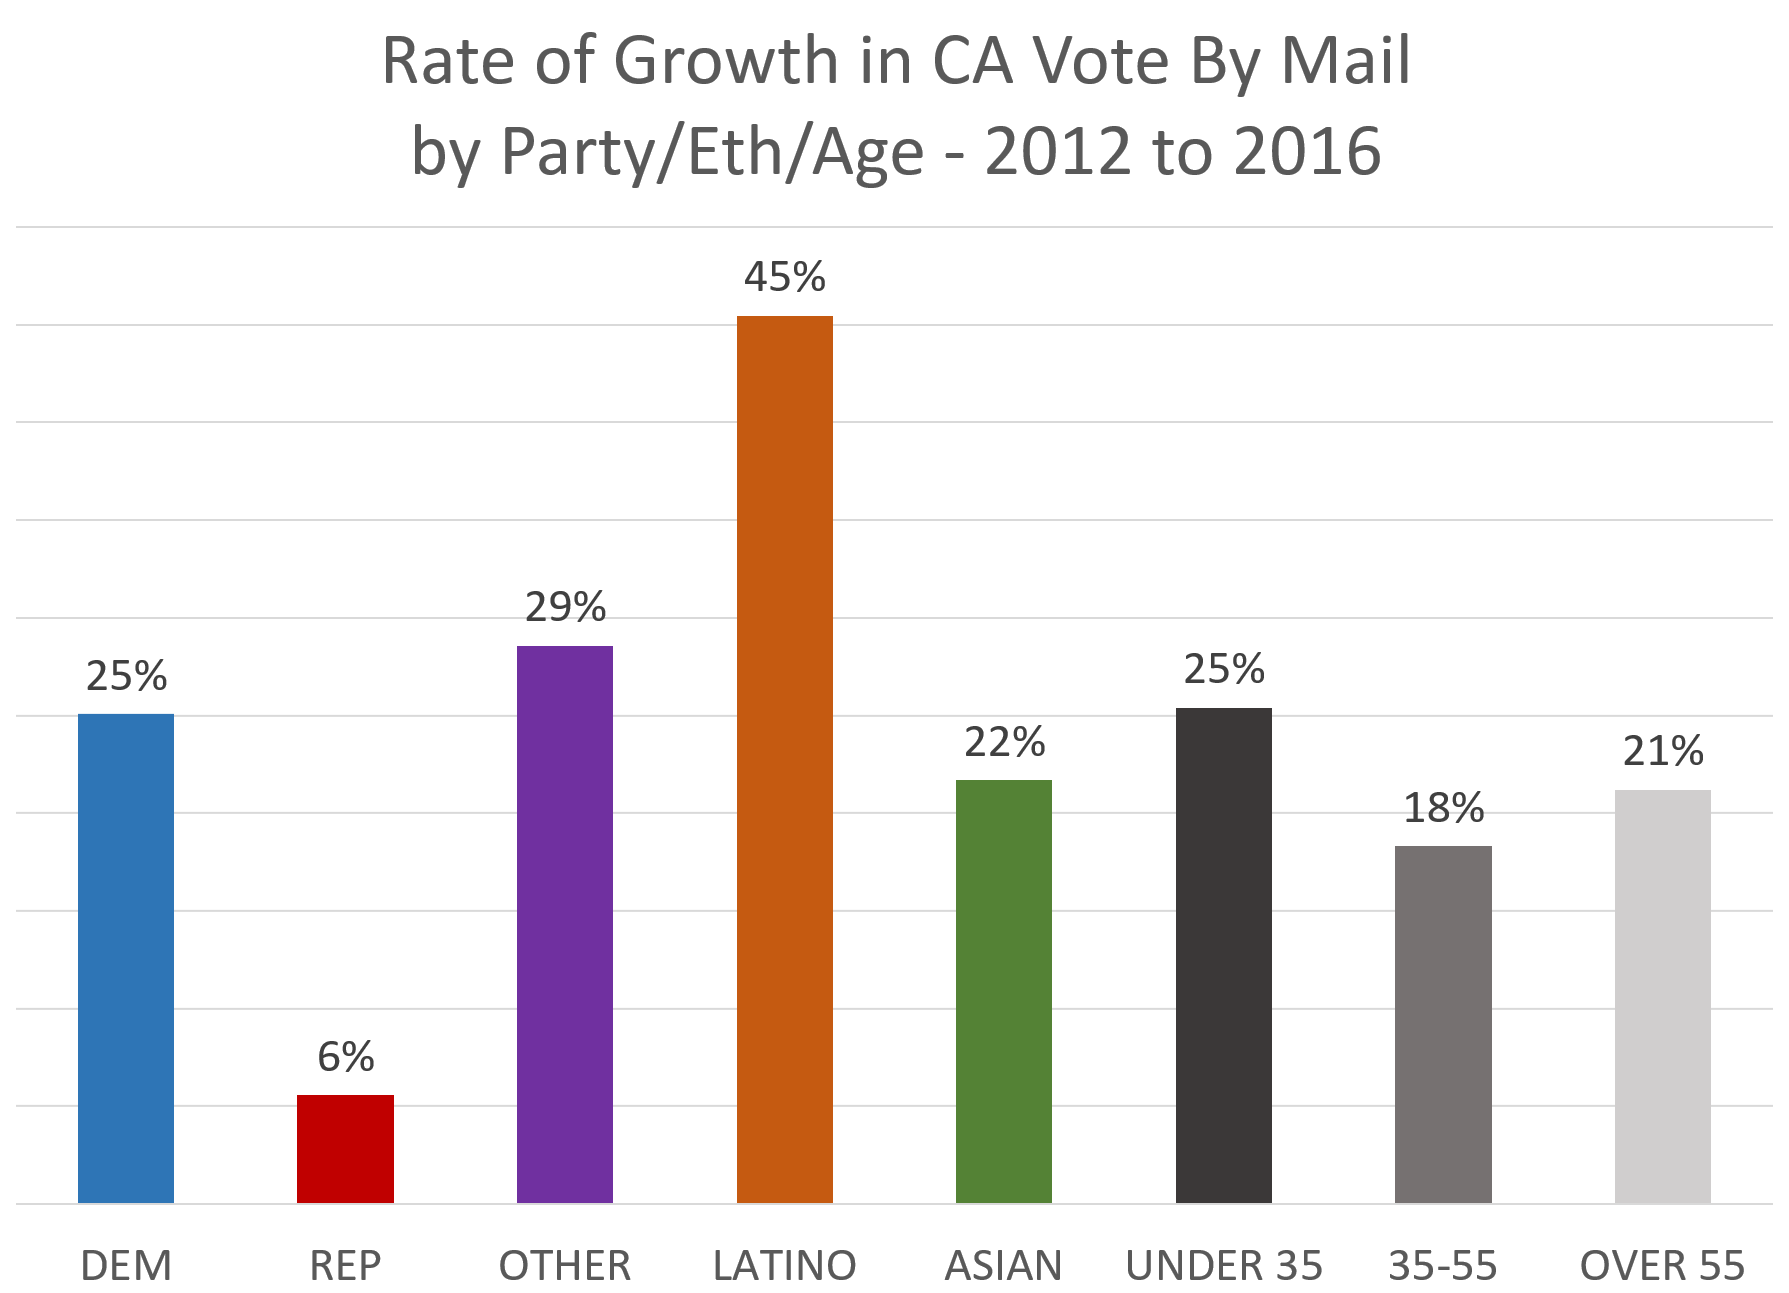
This should cause us to adjust our expectations for what we will see in early voting comparisons between 2012 and 2016. A big performance by Latinos, Democrats or independents, relative to their total 2012 early returns would be totally expected, and not necessarily a sign of a coming tidal wave of total turnout.
The 2016 Early Returns
As of 12 days until the election, more than 2 million voters have cast ballots in California.
But, these returns have varied greatly among groups – none of which is more striking than the age breakdown. More than a third of seniors have returned their ballots, yet less than 10 percent of millennials have done the same.
| TOTAL | 11,031,298 | 2,071,985 | 19% |
| 18-24 | 1,206,163 | 76,775 | 6% |
| 25-34 | 1,828,651 | 167,835 | 9% |
| 35-44 | 1,559,836 | 194,509 | 12% |
| 45-54 | 1,722,183 | 284,679 | 17% |
| 55-64 | 1,936,798 | 444,383 | 23% |
| 65-74 | 1,566,833 | 489,619 | 31% |
| 75+ | 1,210,834 | 414,185 | 34% |
The raw number of ballots returned for Republicans is almost identical to 2012, simply shifted forward four years. But with Democrats we see significant growth in the raw number of ballots cast. 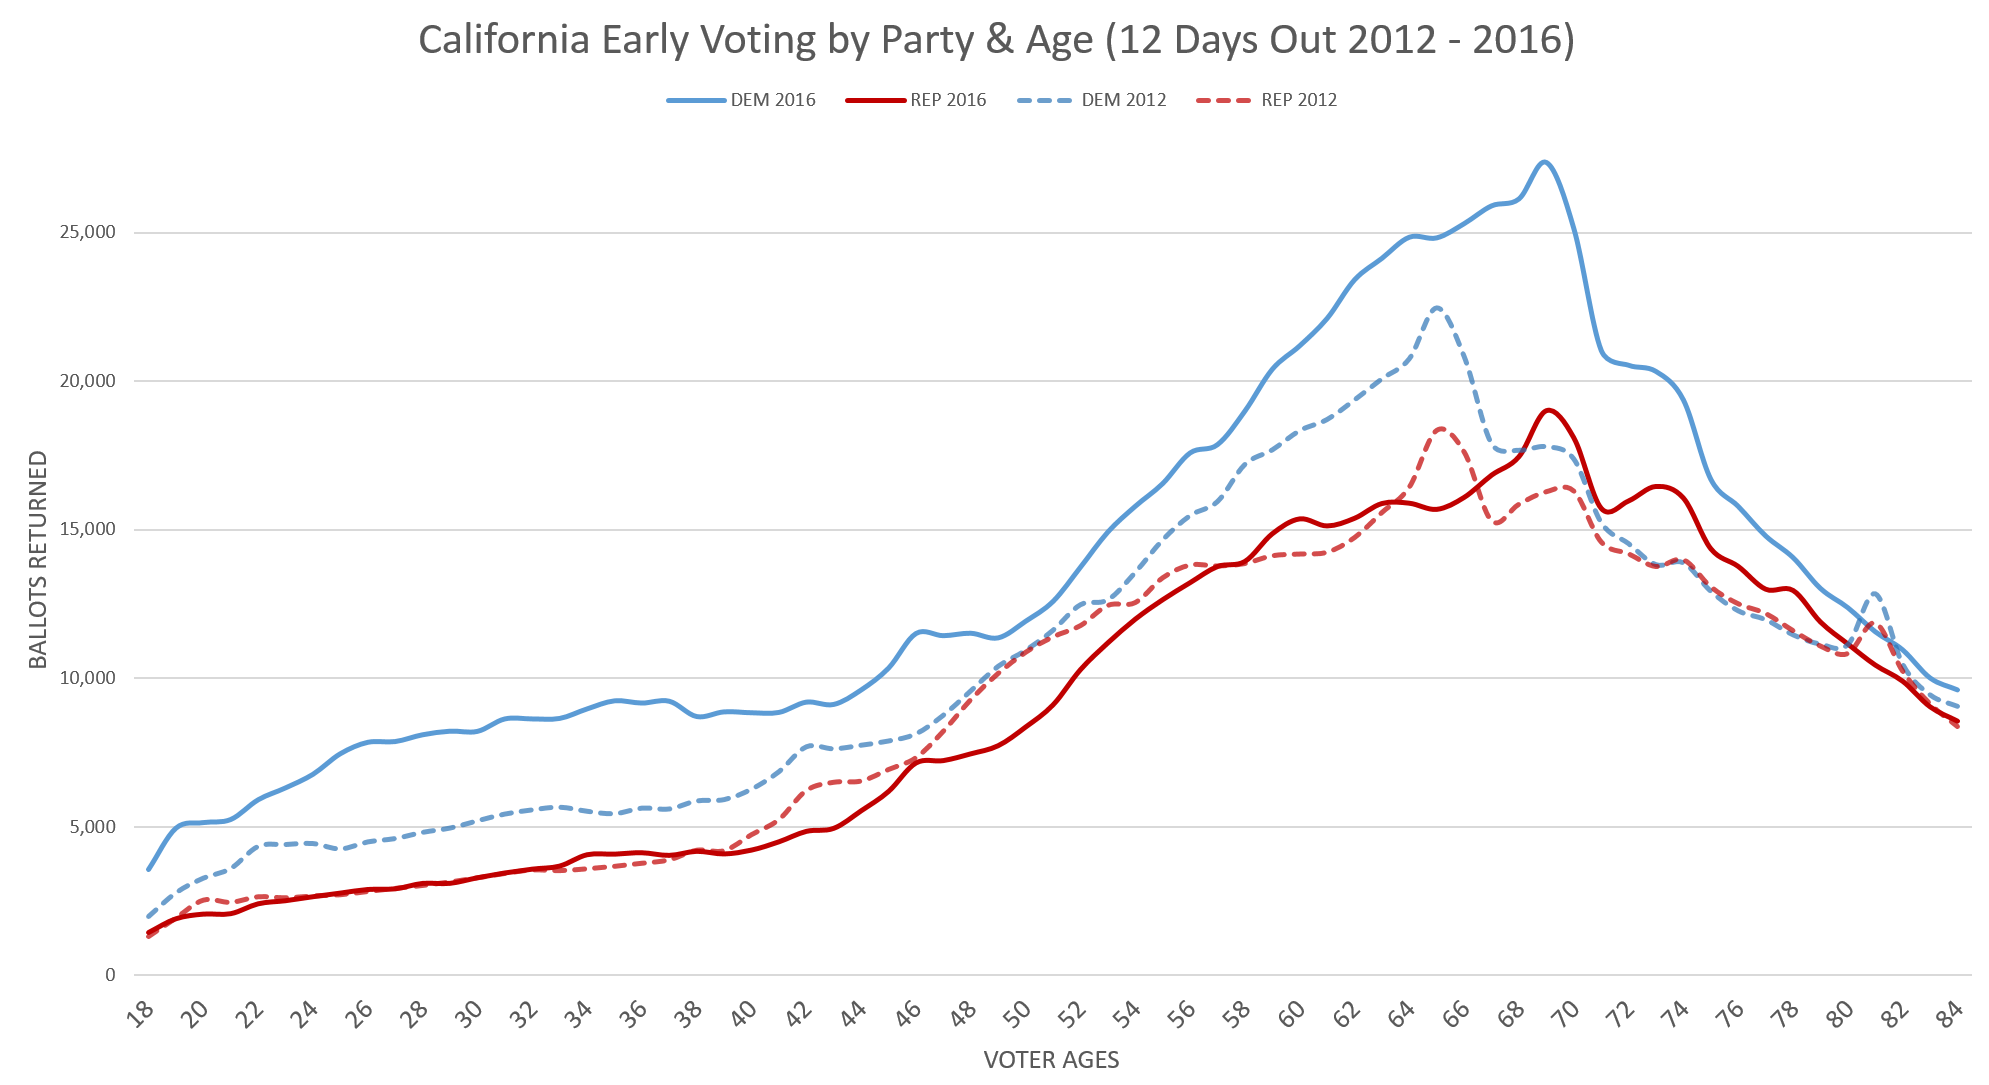
This raw growth for Democrats is up more than 25% compared with the same time period in 2012. Republican growth in the 5%-to-6% range.
But, as was explained above, this raw growth should have been expected, and it needs to be understood in the context of a PAV portion of the electorate that has seen double-digit growth by Democrats.
To look beyond the overall growth of PAV rates, we can look at the percentage turnout by age, rather than total ballots cast. Instead of a raw count of the ballots that have been turned in, in this graphic we see the number of ballots for Democrats and Republicans, divided by the number of ballots that were mailed to these voters. And in this view, the trends tighten significantly. 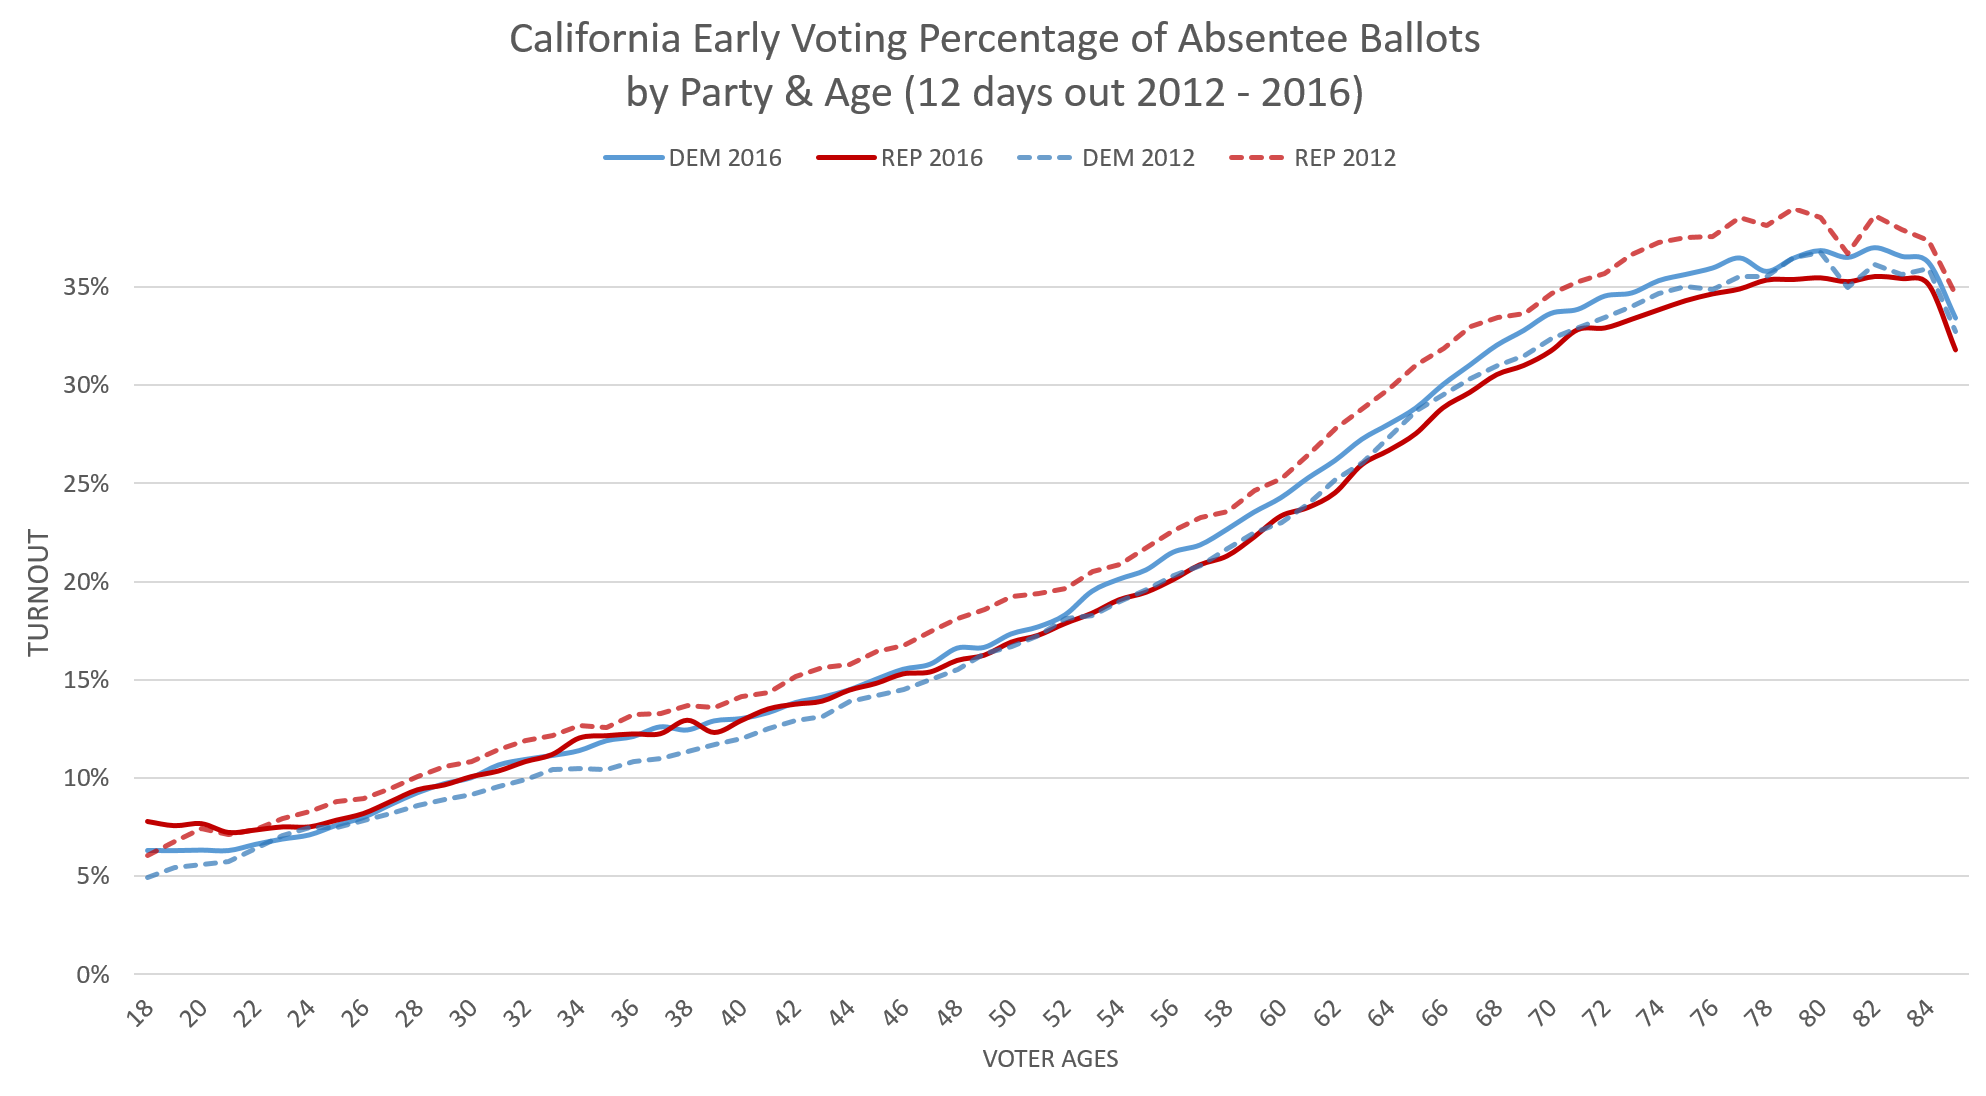
Rather than the large double digit differences, we see Democrats exceeding their turnout rates at this point in 2012 by just two-tenths of a percent, and Republicans under-performing by just 1.4%.
Placing these calculations into age groupings, we can see more clearly where partisans and the state’s growing independent voter populations are under or over-performing at 12 days from the election compared to the same time period in 2012.
| AGE | TOTAL | DEM | REP | Independent |
| 18-24 | 0.2% | 0.4% | 0.2% | 0.1% |
| 25-34 | 0.0% | 0.6% | -0.8% | -0.1% |
| 35-44 | 0.1% | 1.0% | -1.2% | 0.0% |
| 45-54 | -0.6% | 0.7% | -2.0% | -0.6% |
| 55-64 | -0.6% | 1.1% | -2.5% | -1.3% |
| 65-74 | -0.9% | 0.9% | -2.9% | -1.4% |
| 75+ | -1.2% | 0.6% | -2.9% | -1.9% |
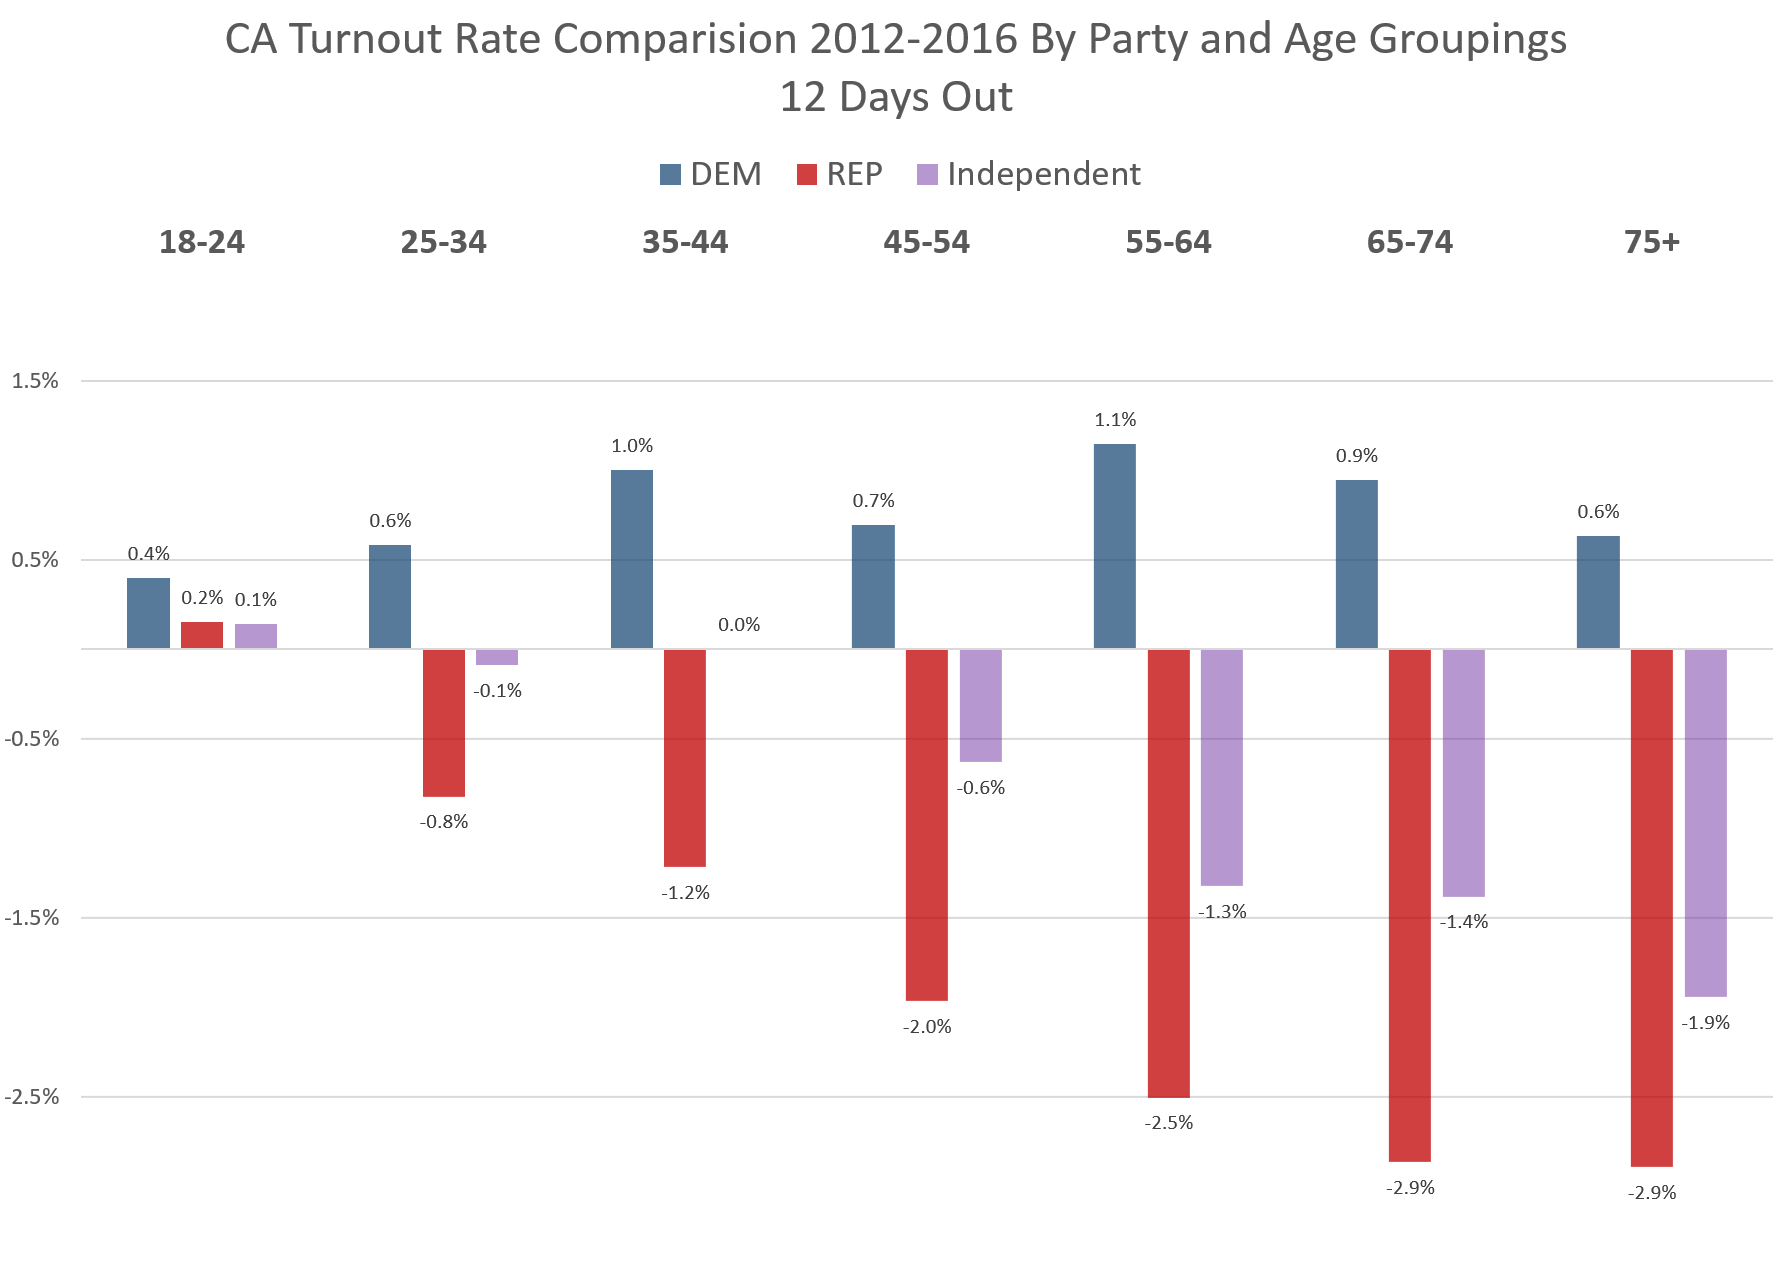
Having stripped away the impact of the higher total number of absentee ballots sent to Democrats, this is likely a better gauge of where enthusiasm is increasing or reducing turnout. Gone are the double-digit leads. Instead, we see a pattern of turnout that has marginal increases for Democrats and a slightly greater decrease for Republicans.
In the end, what does this data tell us?
Clearly, there are more ballots being returned as we see a shift to mail-in voting for a majority of the state’s voters. This has resulted in raw voter returns that largely reflect the growth and changing demographics of the early voting population.
There is also a slight turnout differential appearing. However, the growth that can be attributed to the mechanics of elections is probably four or five times greater than the enthusiasm impact.
This does not mean that all the gains of early voting are wiped away. Getting votes cast earlier allows campaigns to bank their supporters and reduces the number of targets for Election Day efforts.
And there’s this: Getting votes in when your candidate is doing well — or before the October Surprise attacks — can also have a marginal benefit.
—
Ed’s Note: Paul Mitchell, a regular contributor to Capitol Weekly, is the founder of the CA120 column and the vice president of Political Data, Inc., which markets campaign information to campaigns in both major parties.
Want to see more stories like this? Sign up for The Roundup, the free daily newsletter about California politics from the editors of Capitol Weekly. Stay up to date on the news you need to know.
Sign up below, then look for a confirmation email in your inbox.
[…] projections can fail to capture swings on Election Day. In the June primary, PDI’s Paul Mitchell cautioned in Capitol Weekly on Friday, Latinos and young voters turned out in higher numbers than expected based on the […]
[…] projections can fail to capture swings on Election Day. In the June primary, PDI’s Paul Mitchell cautioned in Capitol Weekly on Friday, Latinos and young voters turned out in higher numbers than expected based on the early […]
[…] projections can fail to capture swings on Election Day. In the June primary, PDI’s Paul Mitchell cautioned in Capitol Weekly on Friday, Latinos and young voters turned out in higher numbers than expected based on the early […]