News
CA120: An odd tale of prisoners and redistricting
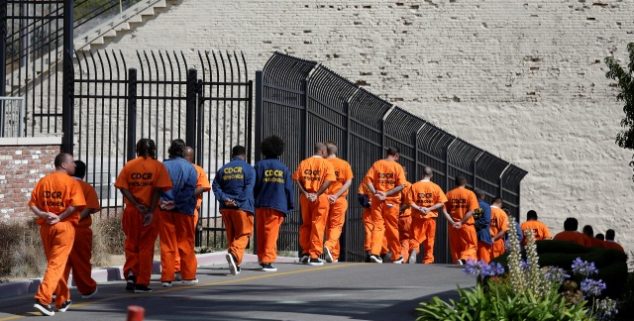 General population prisoners at San Quentin march in a line. (Photo: Eric Risberg/Associated Press)>
Much of redistricting law is arcane and technical. But often what seems like a little detail can become a significant factor in how the lines will be drawn.
Take, for example, prisoners.

The U.S. Census counts prisoners just like any other part of the overall population. The Census captures people at their “usual residence,” meaning the place where they live and sleep most days. If they don’t have a usual residence, then they are counted based on where they are on April 1 of the census year. This could be a home, college dorm, shelter or prison.
In redistricting, this population is used to determine the size of a political district.
However, counting inmates at their prison location actually inflates the representative power of the people who live in areas with prisons.
And it dilutes the representation for people in the areas where prisoners originally were living before they got locked up.
Here’s how that works.
If Congressional District A has 20,000 prisoners that are actually from District B, then District A gets to be smaller in real population, and that is an advantage. In this example, District A has fewer people who are actual residents of the district — those who need services, go to schools, use roads and parks, and potentially vote for their representative – but they still get a full member of Congress.
District B, on the other hand, being shorted 20,000 residents, has to grow. To make up for the shortage it will expand and could have its votes diluted by taking in another neighboring city to make up for the missing population.
Put into the “one person, one vote” equation, a population difference of 20,000 in these congressional seats means that District A is getting “.97 person, one vote” while District B is getting “1.03 person, per one vote.”
District B’s vote is being diluted by 3%.
This issue was raised in the state’s last redistricting, but the redistricting commission did not have the ability, legally or within the data it was provided, to reallocate population to rectify this imbalance, so no adjustments were made.
However, shortly after the commission began, then-Assemblyman Mike Davis authored Assembly Bill 420 to give guidance to the 2020 redistricting commission.
This law requests the Citizens Redistricting Commission to deem each incarcerated person as residing at his or her last known place of residence, rather than at the institution of his or her incarceration. It imposes a requirement on the Department of Corrections to provide data that will allow each prisoner to be allocated to their correct Assembly, Senate and Congressional district based on the address of their residence prior to being arrested.
If the data system isn’t available, this data would revert to the most specific data they can provide – which, at this time, is only the county of residence.
To analyze the impact of this change in redistricting law we obtained a dataset from the Corrections Department that shows where the current 130,000-inmate prison population is currently housed and also provides information on the county in which these prisoners resided prior to their incarceration.
This data was then mapped to legislative and congressional districts, allowing us to begin to understand the impact.
The following shows the five most impacted districts based on population that would be taken out of their district with the reallocation of prisoners:
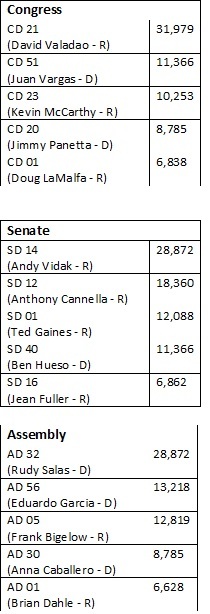
(Data table: Paul Mitchell)
In California the allocation of prisoners is very uneven, largely because most prisons in California are located in remote and rural parts of the state. It therefore makes sense that the most impacted incumbents are those with more rural voters.
Additionally, nine of the 15 seats are held by Republicans, a disproportionate share given that the supermajority of all legislative and congressional incumbents are Democratic.
The full impact of this is best understood looking at Congressional districts as can be seen in this interactive graphic which looks at both the loss of population by district, and the increases in population due to the reallocation to the prior residence by county.
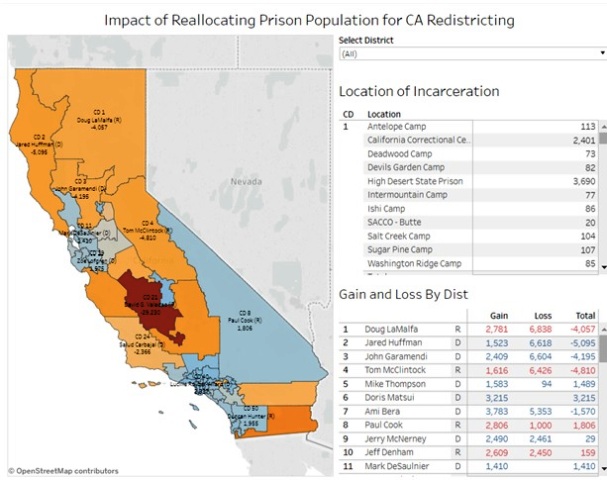
Prison population relocation and redistricting. (Graphic: Paul Mitchell)
The biggest loser among all Congressional Districts would be the 21st currently held by Republican David Valadao. This is a district that we already know from a previous article has slipped behind by 6,414 voters based on the American Community Survey. So, the impact of both factors could cause a shortfall of 35,000 voters requiring the district to absorb the equivalent of three average-sized California cities in order to meet population requirements.
For this dataset, the prison population is being reallocated to each county, and then to each district within the county based on the population of those 18 years and older in each legislative or congressional district.
This is clearly less than ideal since it treats all areas of a county as being equally likely to have an incarcerated population. The most striking flaw would be in Los Angeles County where the incarcerated population is being spread evenly, despite wide variations in arrest rates by cities and communities within the county.
While the data is imperfect, it’s reasonable to expect that the data is not going to be better by 2021.
So this is likely the same method that will be used by the Redistricting Commission, if it follows the intent of the Davis legislation.
And that could be a contentious issue, given its partisan implications and impact on certain high-profile incumbents.
—
Ed’s Note: Paul Mitchell, a veteran political strategist and a regular contributor to Capitol Weekly, is the founder of the CA120 column and the vice president of Political Data, which markets information to campaigns in both major parties.
Want to see more stories like this? Sign up for The Roundup, the free daily newsletter about California politics from the editors of Capitol Weekly. Stay up to date on the news you need to know.
Sign up below, then look for a confirmation email in your inbox.
Paul, Only slightly different was my Patton State Hospital where the 1100 or so came from all over southern California but resided now in my district. Unlike prisoners since these folks were not guilty by reason of insanity, or incompetent to stand trial, or (old days) mentally disordered sex offenders all of these people could and often did register to vote. Tough for precinct walking but they did get mail. They were in my district but not free to roam my district. And yes I won that precinct every election.