News
CA120: Voter registration is huge, partisan and volatile
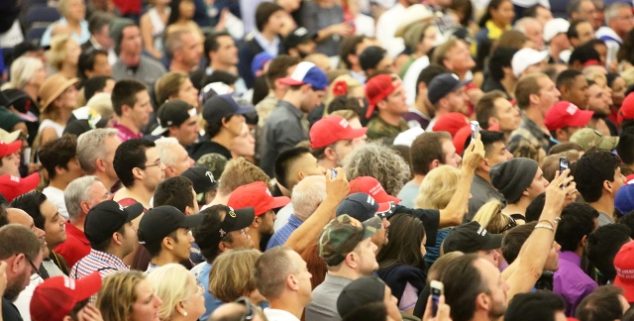 People at a May rally of Republicans in Anaheim. (Photo: Mike Ledray, Shutterstock)
Prior to the June Primary, California experienced a massive surge in voter registration. More than 2.3 million voters registered, either for the first time, or as a re-registration.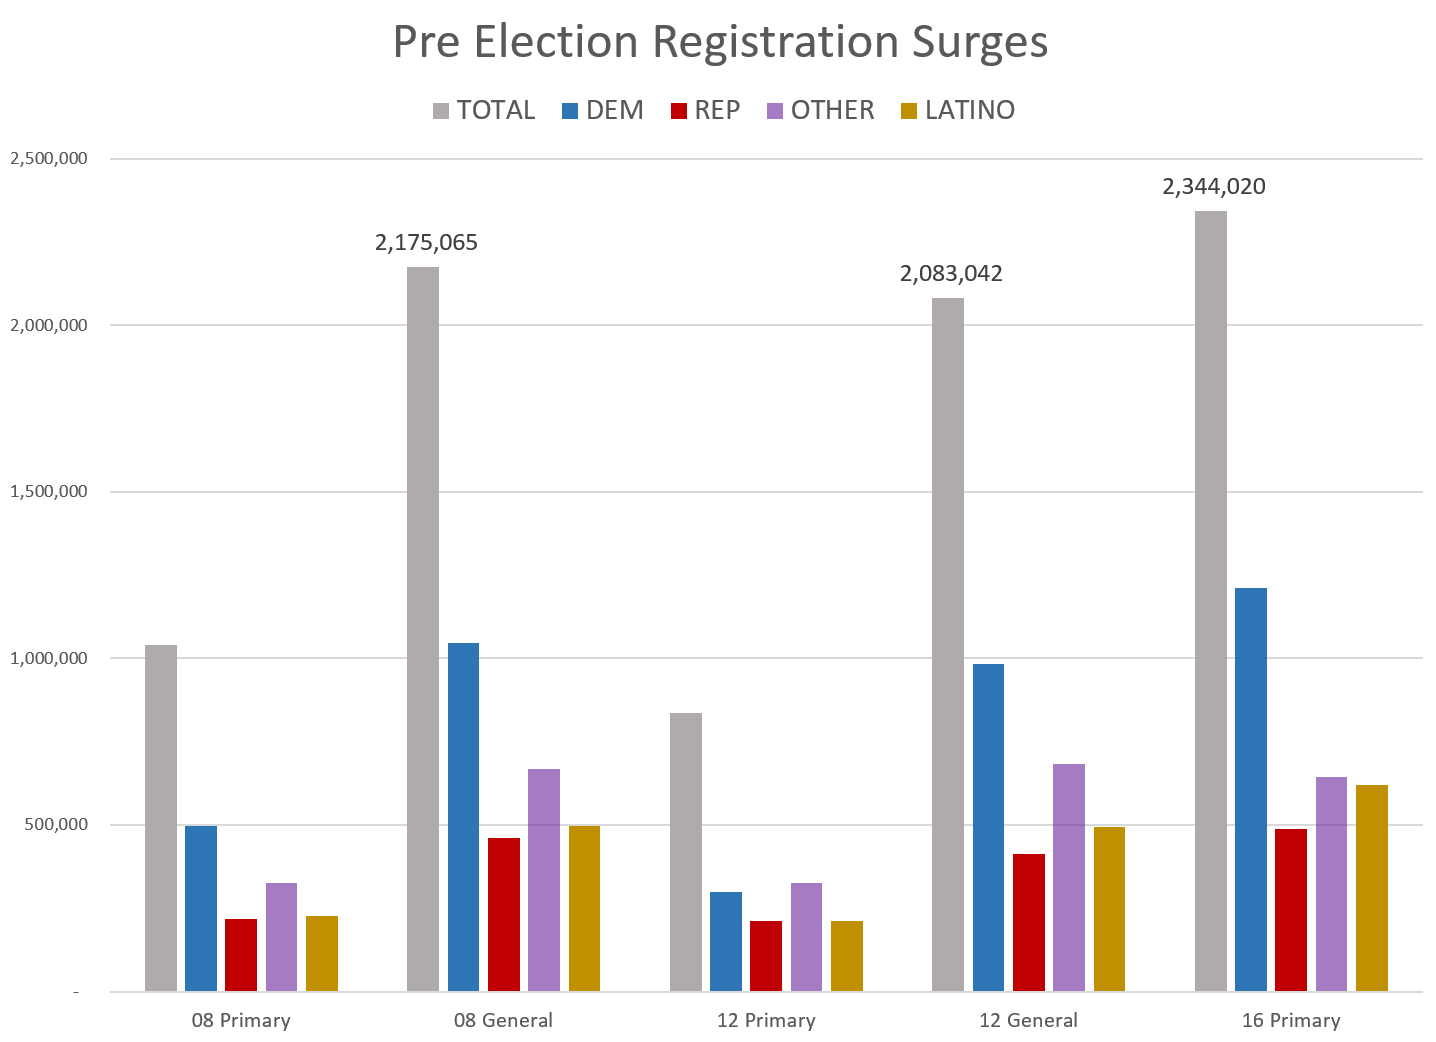
This was not only larger than any other primary election in the state’s history, it was larger than any general election.
As measured by absolute growth of the voter file, the nearest comparison was the 1980 primary in which former California Governor Ronald Regan was running for the Republican Party nomination.
This registration was also much more partisan than we had seen in prior years. For the last three months prior to the election, nonpartisan and minor-party voters were only 27% of total registrants, compared to 42% in the first half of 2015. This was the largest group of registrations for every two week period from December 2014 through September of 2015 but slipped to second, briefly third, during the run up to the primary.
Los Angeles County has for the first time in its history exceeded five million registered voters, and the state is on track to reach 19 million by the time of the general election.
At the time of the primary season surge, one growing school of thought was that this was not true growth in registrations for 2016, but simply a front-loading of the registration that would normally happen in September and October leading to the General Election.
This theory recognized the impact that the surge had on the primary, but presumed that this surge would flat-line heading into the General.
But what have we seen?
First off, we saw a massive level of voter registration on Election Day. Over 160,000 registered on June 7, and more than 240,000 registered that week. Presumably, these included a lot of voters who didn’t know about the deadlines, or who found a problem with their registration when they got to the polls.
Since the election, as in the primary, we have seen a rate of registration that significantly out-paces the 2012 election cycle.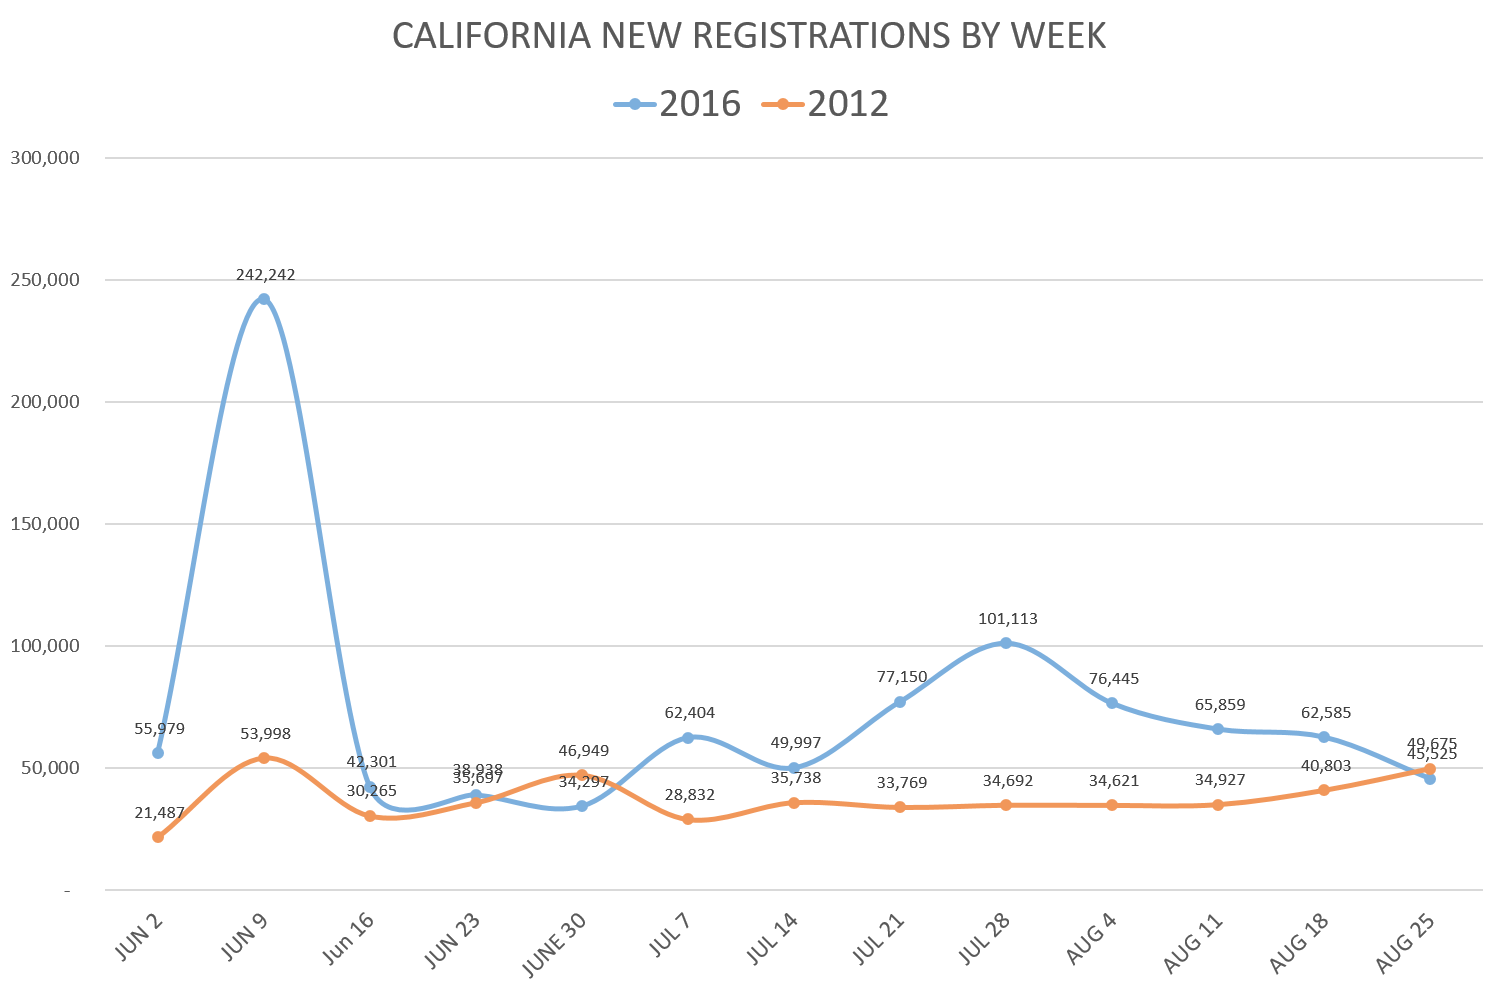
From July through the end of August, registration rates have been more than twice that of 2012. Los Angeles County has for the first time in its history exceeded five million registered voters, and the state is on track to reach 19 million by the time of the general election.
For a sense of scale, nearly 30% of households in California have a voter who is a new or re-registrant, and this should rise to more than a third in the coming weeks. At this point in 2012, only 12% of households had a new or recent re-registrant.
This increase has been greatest among Democrats and independents, as Republican registration has been more consistent or lower than their rates in 2012. That was a year with relatively high Republican registration, given the contest against an incumbent Democratic president.
One interesting element of this surge isn’t just that large numbers of Californians are registering; it’s how they are registering. We know that pre-primary registration was much more partisan, but looking at a longer time frame, three periods become visible.
From the end of the 2014 to mid-September of 2015, voter registrations were not accelerated and clear trends showed the growth of independent voters as a portion of the voter file. Then, as the Trump candidacy became a growing force in the media and the presidential debates begin, registration becomes increasingly partisan, and independent registration continues a precipitous drop.
Finally, the post-primary phase we are in now shows a resurgent nonpartisan voter registration as those voters who might have sat out of the primaries are coming to vote in the General Election.
Registration Breakdown – 2014 General – Current, By Period
| Pre Primary | Primary Season | Post-Primary | |
| DEM | 39% | 52% | 50% |
| REP | 21% | 21% | 16% |
| OTHER | 40% | 27% | 34% |
Additionally, while the primary election did not lend itself to massive paid voter registration drives, the General Election is bringing out significant voter engagement efforts. 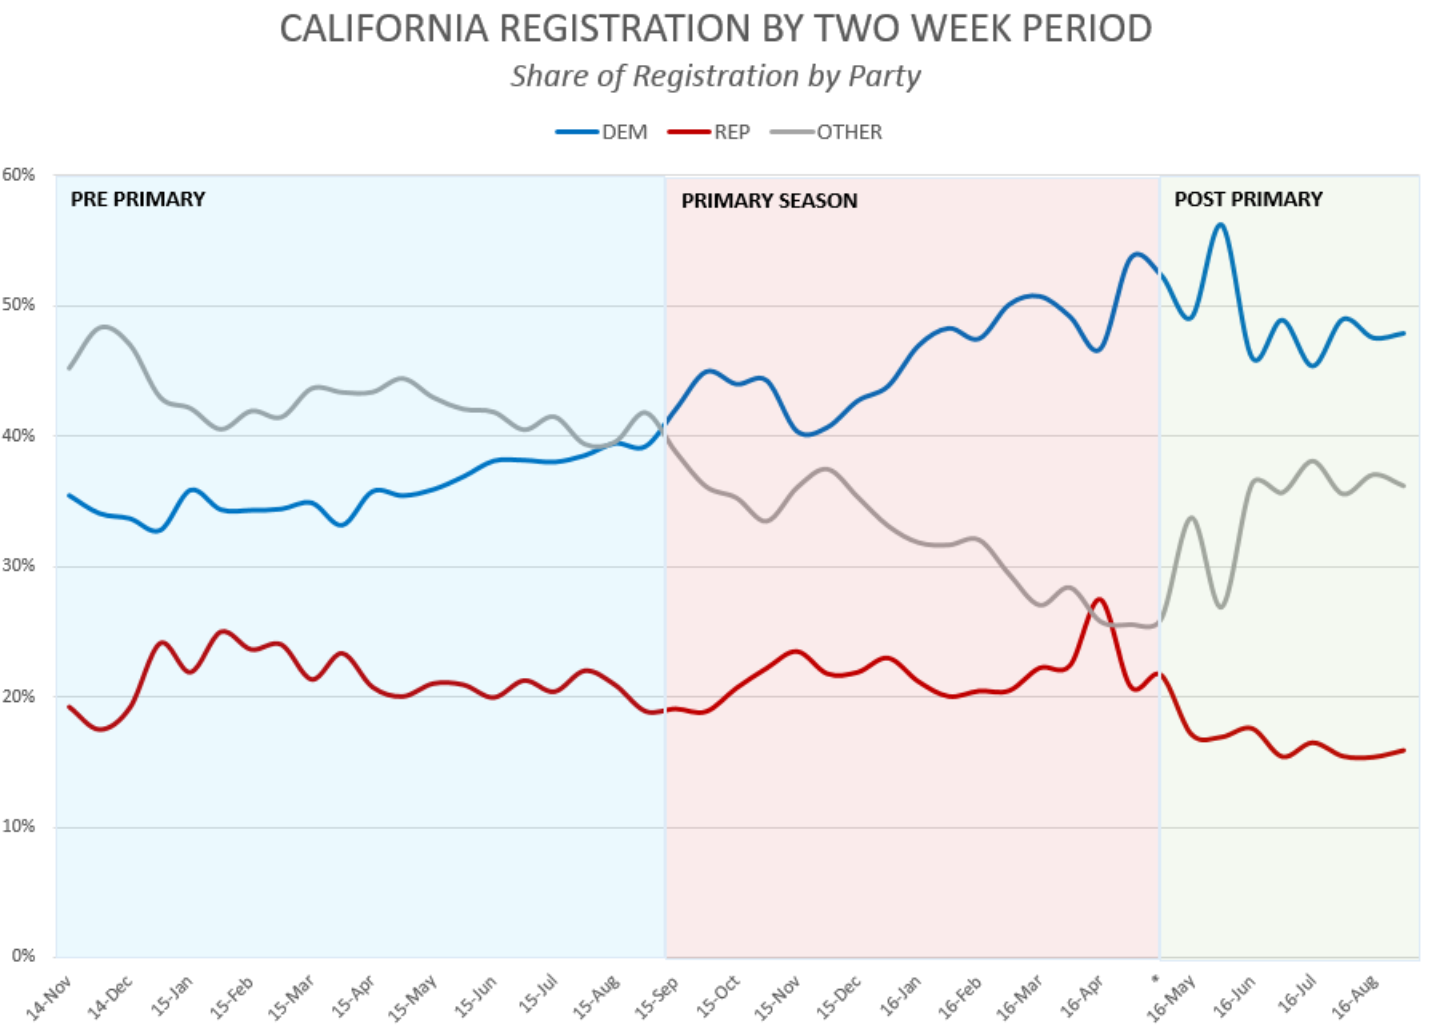
This can partially be seen in the differences between online registrations, and those done with traditional paper forms more often used by organized voter registration drives. Those using the online system have skewed strongly independent, even reaching a point where non-partisans are again the plurality of all registrations, while paper registrations have been much more heavily Democratic. 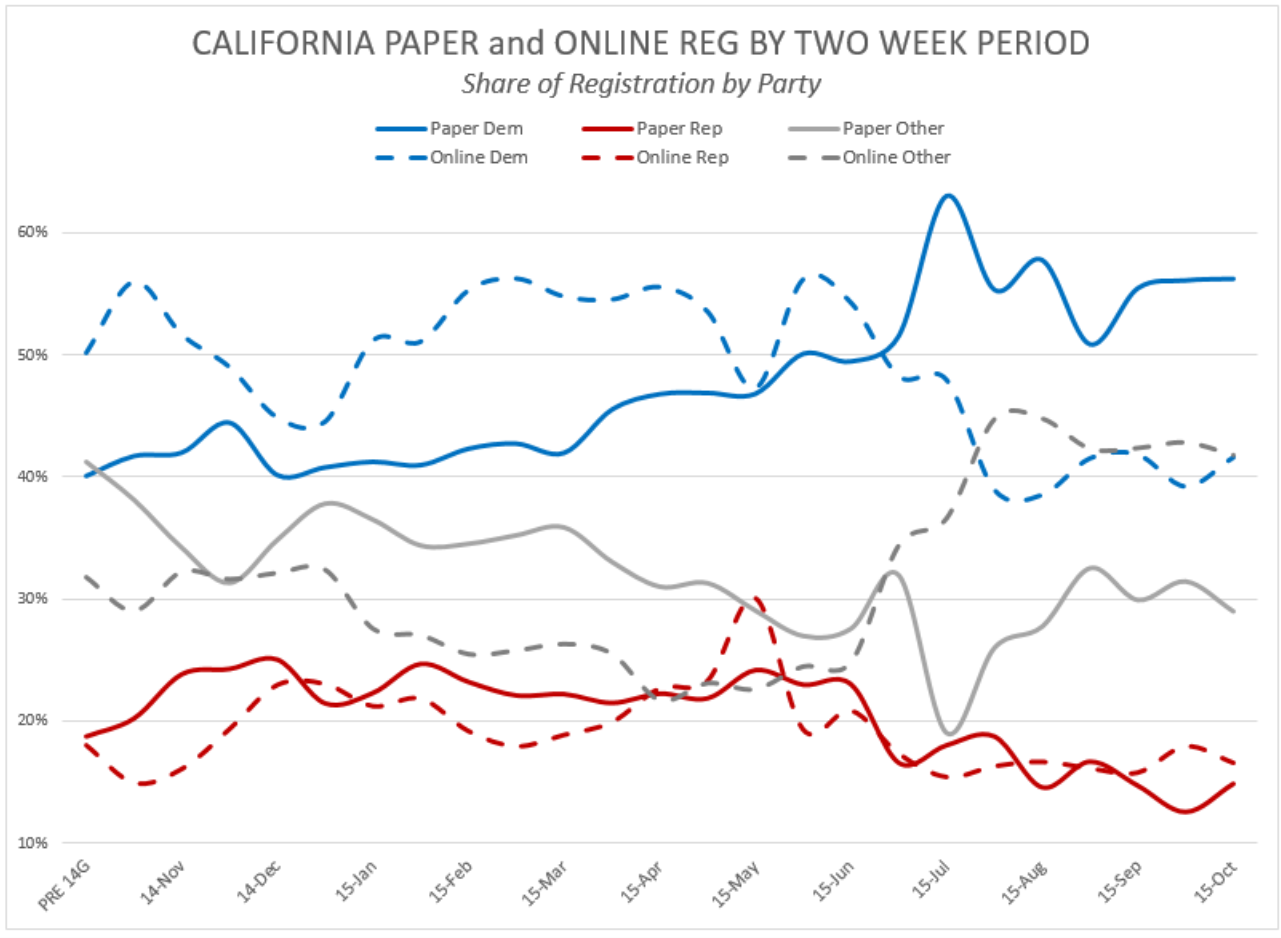
A look at the overall registration from the beginning of the year until Sept. 1 in each of the past presidential elections shows how this new wave of registrants looks more like the 2008 election cycle in terms of partisanship.
It also shows how each election cycle has seen slightly higher rates of Latino registrants, and how the absolute growth of young and foreign-born voters has increased — but not always proportionally larger than in past presidential election cycles.
Registrations Jan 1 – Sept 1 – Presidential Election Year
| 2008 | 2012 | 2016 | ||||
| TOTAL | 1,843,576 | 1,291,096 | 3,388,801 | |||
| REP | 409,427 | 22% | 320,262 | 25% | 659,843 | 19% |
| DEM | 908,680 | 49% | 495,920 | 38% | 1,733,681 | 51% |
| OTHER | 525,469 | 29% | 474,874 | 37% | 995,277 | 29% |
| LATINO | 422,240 | 23% | 326,307 | 25% | 924,812 | 27% |
| ASIAN | 132,971 | 7% | 98,108 | 8% | 280,307 | 8% |
| WHITE | 1,208,284 | 66% | 837,796 | 65% | 1,937,052 | 57% |
| FOREIGN BORN | 369,155 | 20% | 219,129 | 17% | 510,183 | 15% |
| 18-24 | 448,935 | 24% | 357,589 | 28% | 817,629 | 24% |
| 25-34 | 414,507 | 22% | 271,824 | 21% | 879,640 | 26% |
| 35-44 | 325,201 | 18% | 192,605 | 15% | 530,728 | 16% |
| 45-54 | 279,862 | 15% | 178,423 | 14% | 425,834 | 13% |
| 55-64 | 200,406 | 11% | 150,001 | 12% | 377,442 | 11% |
| AGE 65+ | 372,593 | 20% | 138,649 | 11% | 353,123 | 10% |
One caveat to all this registration news: Big registration numbers in past presidential election years didn’t come until around mid-September, so we have yet to see a real comparison to the greatest surging of voters in that previous presidential cycle.
If 2016 simply held to the same surges as 2012 and 2008, it could be expected that the total voter registration would reach between 18.8 to 19.5 million – record voter registration by a large margin.
The big question for the next month will be if voter registration continues to surge, or if it is reaching a point where there are fewer gains to be made.
Want to see more stories like this? Sign up for The Roundup, the free daily newsletter about California politics from the editors of Capitol Weekly. Stay up to date on the news you need to know.
Sign up below, then look for a confirmation email in your inbox.

Leave a Reply