News
Highway deaths: Red states vs. Blue states
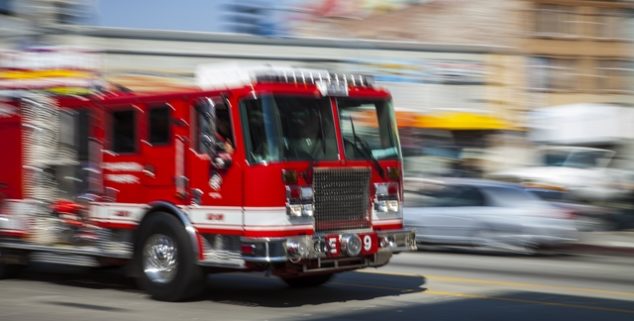 A fire truck races to an emergency in downtown Los Angeles, 2016. (Photo Alexandre Moraes, via Shutterstock)
November’s presidential contest was bizarre in many ways, but there is one peculiarity that pundits haven’t pounced on: The states with the worst rates of traffic deaths in the country went solidly for Donald Trump while Hillary Clinton swept states with the lowest fatality rates.
That odd association between traffic deaths and how states voted echoes what happened just over four years ago, when this red-blue divide first came to light. As FairWarning reported in 2012, low fatality states voted blue to re-elect President Obama, while states with higher death rates went red for GOP challenger Mitt Romney.
California was 10th from the bottom in its traffic fatality rate — about 8.11 deaths per 100,000 people.
Analysts have concluded that it chiefly reflects the more rural character of the crimson states, versus the more urban makeup of the blue ones.
This November’s presidential voting reshuffled the deck somewhat. Six states that were Obama blue in 2012 turned red in 2016, delivering a victory to the GOP’s Trump. Yet the correlation between traffic death rates and presidential voting actually appears slightly stronger.
“Not only is there a connection, it’s really quite amazing,” said Joni Graves, a Wisconsin traffic consultant and researcher.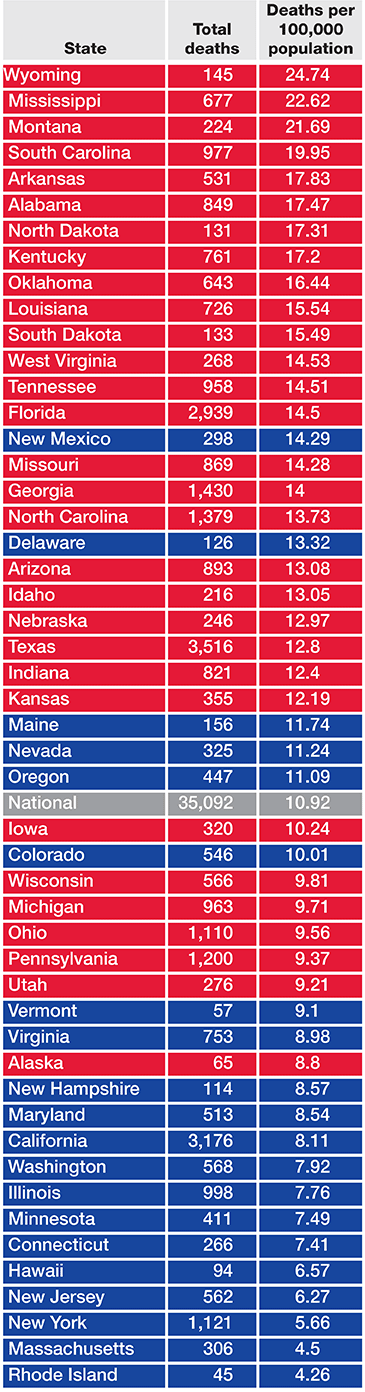
In all, the 14 states with the highest fatality rates went into the red column, supporting Trump. In contrast, the 12 states with the lowest fatality rates were blues that favored Clinton. In these calculations, fatality rates were determined by counting the number of road deaths in 2015 per every 100,000 people.
(In 2012, by comparison, 10 states with the highest fatality rates were reds, and the eight states with the lowest rates were blues.)
‘Surprising On Its Face’
At first blush, experts struggle to come up with convincing explanations for the phenomenon. “It is surprising on its face,” acknowledged Jessica Cicchino, vice president of research for the Insurance Institute for Highway Safety, a Washington nonprofit organization.
Yet, after evaluating the pattern, Cicchino, Graves and other analysts have concluded that it chiefly reflects the more rural character of the crimson states, versus the more urban makeup of the blue ones.
Eighteen states have speed limits of 75 mph or higher on certain roads. Among those high speed limit states, the reds outnumber the blues 13-to-5.
Cicchino noted that, taking the number of miles traveled into account, deaths on rural roads are about 2½ times higher than on urban thoroughfares. U.S. figures for 2014 indicate 1.82 deaths per 100 million miles traveled in rural areas, versus 0.76 deaths per 100 million miles traveled in urban areas.
One likely reason for the difference is that rural motorists are apt to be going fast when they crash, while urban drivers are more likely to travel slowly on roads choked with traffic. Other residents of urban areas are more likely to be taking mass transit.
The higher driving speeds also may stem from varying state laws. According to the Insurance Institute for Highway Safety, 18 states have speed limits of 75 mph or higher on certain roads. Among those high speed limit states, the reds outnumber the blues 13-to-5.
In rural areas, roads also are more likely to be undivided, two-lane thoroughfares, so it’s easier for a driver to cross over into oncoming traffic. And after a crash occurs, emergency medical service in rural communities may be farther away and less sophisticated than in the big cities.
Another likely factor behind high fatality rates in red rural states is that their residents tend to be poorer. As a result, “Their cars are probably in worse repair. There can be a missing light in the back, or the clutch goes out,” said sociologist Arlie Russell Hochschild, author of the 2016 book “Strangers In Their Own Land,” which explored views of conservatives in red state Louisiana.
Hochschild also said “a kind of cowboy mentality, a kind of deregulatory, anything goes culture” exists in red states might lead to more reckless driving.
One form of risk-taking is failing to wear seat belts. According to a national estimate, 90.1 percent of drivers and front-seat passengers buckled up in 2016. Although there are plenty of exceptions, recent numbers show that states with lower rates of seat belt use have tended to be red.
Rising Death Toll
The new evidence of a red state-blue state divide comes as road fatalities are climbing, bucking a trend of generally declining U.S. traffic deaths since the 1970s, when the totals some years exceeded 50,000. In 2015, traffic fatalities reached 35,092, up 7.2 percent from the year before – the biggest single-year increase since 1966. An estimate from the National Highway Traffic Safety Administration covering the first nine months of 2016 points to yet another rise, about 8 percent.
Louis V. Lombardo, a road safety activist and former NHTSA scientist who in 2012 brought to light the election-traffic deaths correlation, says he doesn’t actually dwell much on the phenomenon. He says his real interest is in preventing road deaths.
To that end Lombardo has championed measures such as using air ambulances to speed emergency medical care for crash victims. He also faults his former agency for failing to set strong standards for vehicle crashworthiness and for such technologies as automatic braking and automatic crash notification systems on vehicles to promptly alert emergency medical responders.
“Never before in the history of humankind have we had more technology available to reduce deaths and serious injuries than we have today,” Lombardo said.
Yet, he said, even though tens of thousands of Americans die on the roads every year, “neither the Democrats nor the Republicans have adequately addressed this question.”
—
Ed’s Note: Stuart Silverstein is the assistant editor at FairWarning, a nonprofit news organization based in Los Angeles and a regular contributor to Capitol Weekly. This story appears here with FairWarning’s permission.
Want to see more stories like this? Sign up for The Roundup, the free daily newsletter about California politics from the editors of Capitol Weekly. Stay up to date on the news you need to know.
Sign up below, then look for a confirmation email in your inbox.
I don’t agree with the speed limit correlation, is so far as Interstates or other high speed design divided highways are concerned (25 years transportation planning experience here). However, the two lane correlation, poor vehicle maintenance and most other noted factors make a lot of sense. I’ve lived on the west coast most of my life, but visit the midwest on a regular basis. There is a definite difference in driver behavior, road knowledge, judgement and visible vehicle condition. Also, truck speed limits are generally too high. It’s an inhumane way to reduce the number of Trump voters, to be sure !
The 2015 numbers are just estimates at this point, I believe. I’m sure we’re going to see a rise YOY in any case, though, and IMO caused largely by increasing driver distraction.
I would disagree that there’s any significant effect from cars being driven by poor people in the red states experiencing mechanical failure and causing accidents. Few accidents are attributed to mechanical issues. Medical issues might be more of a factor