Analysis
Poll: Bernie up with independents, but Hillary still holds sway
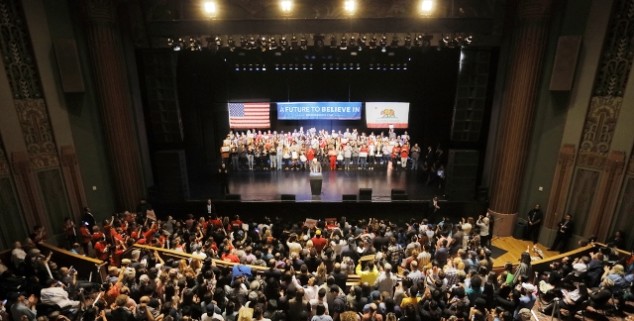
 California supporters of Bernie Sanders attend a rally. (Photo: Joseph Sohm)
It may not be as consequential a contest as we had hoped for a few weeks ago, but California’s Democratic presidential primary on June 7 still presents a fascinating case study for political junkies.
Bernie Sanders has been stronger in states like California with “open” primaries — those that allow non-Democrats voters to cast a ballot. California Democrats allow voters not registered with any other political party to vote in their primary.
But the question is this: In what numbers will these non-partisans vote? Can Sanders surf this wave of support to a victory in California?
The answer, according to our data, is probably not.
Click here to see the survey’s methodology and results. The survey of 1,617 people was conducted between April 28 and May 1.
While our latest poll of Democratic and No Party Preference (NPP) likely voters shows Sanders leading among the non-Democrats by 15 points, Hillary Clinton leads overall 49% to 39%, holding a 14-point advantage among partisans.
The final result likely will be closer, however, and there is some hope for Sanders, based on the overwhelming support he has received from new registrants since January 1, 2016.
But this group of new registrants is far smaller, only 16% of the number of likely voters. If that entire group were to vote, and favor Sanders by an 80%-to-20% margin, it would almost close the current gap. Our data — admittedly a small sample – shows Sanders leading Clinton in this group by 67%-27%.
That Sanders advantage could be blunted by any higher-than-expected turnout of African-American and Latino voters, where Clinton has a decided advantage.
Unlike the Republican primary, which awards an equal number of delegates to the winner of each Congressional District, the Democrats award their pledged delegates proportionally within each district and the number of delegates is related to the number of Democrats.
This makes California a microcosm for the presidential race to date.
Even where Sanders is strong, Clinton has enough support to keep any victory margin to a single delegate. Meanwhile, in the heavily African-American and Latino districts in Los Angeles County, Clinton is likely to win by larger margins and earn extra delegates.
In Sanders’ most notable open primary victories, Michigan and Wisconsin, the non-Democratic segment of the electorate was 28%.
Our results estimate them to be 22% to the Democrats’ 78%, the same proportions as in the Field Poll early last month. But that margin is for the primary election overall.
In our survey, one-third of NPP voters said they did not plan to vote in the Democratic presidential primary. The remainder is evenly split between re-registering as Republicans or not casting a presidential vote.
That alone takes the NPP percentage under 20%.
Then there is the additional issue for NPP voters described in depth on this site last week – the half of NPP voters who are Permanent Absentee Voters and must fill out and return a card to their County Clerk requesting the Democratic presidential ballot. As Paul Mitchell pointed out, the return rate has been anemic thus far. If half of these voters don’t end up with a Democratic presidential ballot, the NPP percentage for that election falls to around 15%.
Sanders’ outsider persona also is somewhat limited in its appeal in California, as more than four-in-five primary voters say that President Obama has done an “excellent” (39%) or “good” (43%) job. That figure includes 73% of the NPP voters.
But also, Sanders’ supporters seem to be losing steam, as one would expect based on the fact that Clinton has maintained a substantial delegate lead for the last two months and has led in every national poll, as well. Three out of every four likely primary voters expect Clinton to win the nomination. And by better than a two-to-one margin, more believe Clinton is a stronger general election candidate (59%) than Sanders (28%).
Perhaps most tellingly, only 36% believe Sanders “should continue to campaign as hard as can to win,” while 43% believe he should “tone down his attacks on Clinton so she can start to unify the party,” and 22% believe that he “should suspend his campaign, as he really cannot win.” This kind of pessimism often has the effect of depressing turnout among the less successful candidate’s supporters.
But in an election year that has confounded the convention wisdom more than once, who’s to say there isn’t one final surprise in store?
—
Ed’s Note: The Capitol Weekly polls are conducted by Jonathan Brown of Sextant Strategies and Research using identified likely voters from Political Data Inc. For this study, the second in a series, Democrats and non-partisan voters who are qualified to vote in the Democratic Primary were included. Brown is a regular contributor to Capitol Weekly. He and colleague Paul Mitchell are providing coverage to Capitol Weekly on the 2016 elections in California.
Want to see more stories like this? Sign up for The Roundup, the free daily newsletter about California politics from the editors of Capitol Weekly. Stay up to date on the news you need to know.
Sign up below, then look for a confirmation email in your inbox.

California is NOT an “open” primary. It is semi-closed. Independents CANNOT vote. Only voters registered as “no party preference” and Democrats can vote. Stop spreading misinformation
Ummm, unaffiliated are Independents. You’re thinking of American Independents which is a far-right wing party. No party preference is Independent. There is no such thing as an Independent Party except aIP which doesn’t count. Seriously look up “unaffiliated” on Google and you’ll see it’s just another word for Independent.
NPP is ‘Independent’, yes.. but Who Funds is probably pointing out the possibility of Independent-minded folks mistakenly registered as a member of the American Independent Party. If that’s the case, then they won’t be able to vote on any ticket besides for that confusingly named party. All in all, it’s a reminder to California voters to check their voter registrations to make sure they are registered to their proper party or to have “No Party Preference” before the deadline to re-register on May 23rd.
Unfortunately many thousands of people have registered as AIP without realizing that it is a party, and not simply independent as in “no party preference”. It’s a confusing thing. Best to just say “no party preference” to people, and that it is a Semi-Closed Primary, which is what it actually is. It’s not an Open Primary like Indiana for example.
More lies.v Hillary does not lead in national polls at all.
http://projects.fivethirtyeight.com/election-2016/national-primary-polls/democratic/
fivethirtyeight is such a load of bull, they purposely removed a lot of states where Bernie won because they said she was 90-something percent likely to win and didn’t. I don’t trust that garbage anymore. I bet Hillary paid them to troll us too
HILLARY COMING TO LOS ANGELES TODAY 3 PM, WE ARE GOING THERE TO PROTEST JOIN US, THIS ADDRESS Belvedere Park
4914 East Cesar E Chavez Avenue, East Los Angeles, CA 90022./
the polster that had Michigan 99-1 and Indiana 90-10. I would never have believed this until Indiana but maybe the polls are deliberately wrong. There has never been a year where all the polls are off a bunch of times
Population (2014), Voting history, delegates, *No General Election Swing Influence
*West Virginia – 1.85 million, republican since 2000, 37(60%)=23 – Sanders. Clinton 15.
*Kentucky – 4.413 million, republican since 2000, 60(60%)=36 – Sanders. Clinton 24.
Oregon – 3.97 million, democratic since 1988, 74(60%)=44 – Sanders. Clinton 30.
Clinton 11.
*Montana – 1.024 million, republican since 1996, 27(60%)=16 – Sanders. Clinton 11.
*North Dakota – 739,482, republican since 1976, 23(60%)=14 – Sanders. Clinton 9.
*South Dakota – 853,175, republican since 1976, 25(60%)=15 – Sanders. Clinton 10.
New Mexico – 2.086 million, democratic since 2008, 43(60%)=26 – Sanders. Clinton 17.
Population Total = 13,270,657
Delegate Total = 289
Sanders = 174+1,415=1,589
Clinton = 116+1,705=1,821
Clinton = +232
New Jersey – 8,938,000 million, democratic since 1992, 142(55%)=78 Clinton. Sanders – 64. Poll 4/1-5/3 – Clinton 55%, Sanders 39%. http://www.realclearpolitics.com/epolls/2016/president/nj/new_jersey_democratic_presidential_primary-3443.html
California – 38,800,000 million, democratic since 1992, 548(55%)=301 Clinton. Sanders – 247.
Washington, DC – 658,893, democratic since 1976, 46(70%)=32 Clinton. Sanders – 14.
Total = 48,396,893
Delegate Total = 736
Sanders = 1,589+325=1,914
Clinton = 1,821+411=2,232
Clinton +318
Clinton 2,383-2,232=-150+523=373
Sanders 2,383-1,914=-469+39=-430
—–
Party Ideology – 2016 Presidential Primaries and General Election http://www.lpstrategies.com/2015/08/moderate-independents-and-the-2016-election/
July 9-14, 2015 – National Poll Electorate Party Affiliation
Self-Identified Democrats – 42%
Self-Identified Republicans – 30%
Independents – 22% : Moderate Independents (Likely republican) – 5%, Np Party for Liberals – 17%
Swing (?) 6%
Possible 2016 Swing States : AZ, CO, FL, GA, IA, NC, NV, NH, OH, VA, and WI