Analysis
CA120: What’s wrong with public polling?
 Illustration by Tashatuvango, via Shutterstock.
 Is something wrong with public polling in California?
The 2018 election season has been raucous, even weeks before the first votes are cast. And one of the contributing factors has been the seemingly erratic public polling, particularly in the top-of-the-ticket races.
The veteran political observers at CalBuzz have called this year’s polling a “muddled mess.”
Some of this could be due to issues surrounding ballot designations. In early surveys, pollsters have to make best guesses about what a candidate’s job title will be, and they often get that wrong. ![]()
There are also issues with the huge number of candidates on the open primary ballot – 27 in the Governor’s race, 32 in the U.S. Senate contest.
(Imagine getting a phone survey where it took three minutes just to read all the candidate’s names, party affiliations and job titles – by the end of the list, I would probably forget what the question was.)
To make a phone poll workable, pollsters are limiting the poll to those candidates they think are most viable.
And this can result in a flawed result, such as when SurveyUSA only included two Republican candidates out of 11 running, and found (incorrectly, mind you) that the leading candidate for the second spot in the U.S. Senate race was Patrick Little, a candidate who says he’s dedicating his life to exposing the Jews who are running this country.
Online surveys using emails from the voter file can present a ballot that more closely resembles what a voter will actually receive, but not all public polls are using this methodology.
Making matters worse, SurveyUSA claimed in their findings “for the first time, there is clarity on [Senator Dianne Feinstein’s] likely November opponent” without even making mention of the fact that they didn’t give Republicans the opportunity to select any of the other nine Republican candidates.
The increased use of online surveys using emails from the voter file can present a ballot that more closely resembles what a voter will actually receive, but not all public polls are using this methodology.
Aside from these known issues with public polls, there is a new one which has been creeping into the work of pollsters, particularly in this coming gubernatorial election cycle. This has to do with the makeup of the expected electorate – what pollsters call the “weighting” of the survey.
Weights in polling are used to make the poll look like the expected electorate. Pollsters will look at their survey respondents and examine critical issues: Is the poll skewing too young? Are there enough Latinos? Are there enough Democrats or Republicans?
Democrats are consistent with their share of registration, but Republicans over-perform and Independents under-perform.
And, in elections where these kinds of voter breakdowns significantly impact candidate choices, the initial weighting can actually be the most important part of the survey process.
There are four areas in which public polling to date has been all over the map: partisanship, geography, age and ethnicity.
Partisanship
There is hardly a more important factor in predicting election outcomes than being able to project the political partisanship of the electorate. The basics of partisan turnout appear to be agreed upon by all pollsters – Democrats are consistent with their share of registration, but Republicans over-perform and Independents under perform.
In the average of the public polls, Democratic turnout is hovering around 46%, with a maximum of 49% in the UC Berkeley IGS polling, and a minimum of 44% in SurveyUSA. The average of the last three elections is 45% Democratic, with a high of 48% in the 2006 primary, and a low of 43% in 2010.
But, among the Independent and Republican breakdown we see some inconsistencies from past gubernatorial primaries.
The average of Republican voters in the public polls is 31%, six-points above registration. However the average in the last three gubernatorial primaries is 38%, with a low of 36% in 2014 and a high of 41% in 2010.
In the 2014 gubernatorial primary, L.A. County had 1.3 million more registered voters than the nine-county Bay Area.
For independents (including other small parties), the difference between public polling and past elections is more dramatic. The last three gubernatorial primaries have only averaged 16% of votes being cast by independents, yet the public polling has them as 23% on average.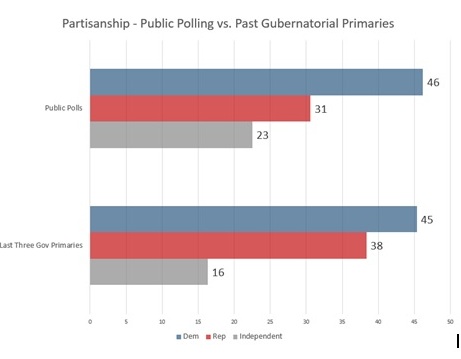
LA vs. San Francisco
As discussed in a recent CA120 article, the registration population in Los Angeles in higher than the Bay Area, yet, in terms of who actually votes, the Bay catapults beyond L.A.
In the 2014 gubernatorial primary, L.A. County had 1.3 million more registered voters than the nine-county Bay Area.
But in terms of votes cast — with 31% turnout in the Bay Area vs. 17% in LA County – L.A.’s edge flipped to a 280,000 vote Bay Area advantage.
For the past three gubernatorial primary elections, the Bay Area has averaged a six-point larger share of the total votes cast. However, the average in political polls shows a one-point advantage for San Francisco. Only one poll, the survey by the Institute for Governmental Studies at UC Berkeley, pegged the San Francisco Bay average to consistent, historic data. (Full disclosure: My company, Political Data, collaborates with IGS and provides samples of registered voters.)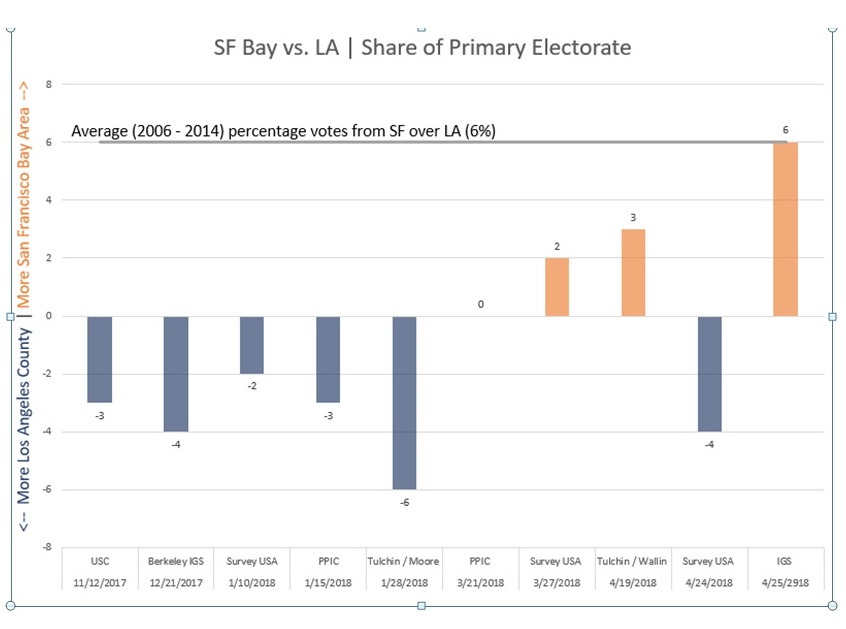
The total range of differential between the polls is a whopping 12-points, with only three of the 10 polls accounting for the historic dominance of the SF Bay Area.
Latino Votes
There is a significant debate about the share of the electorate that will be Latino. This has been sparked by four factors:
–The rise of Latino registration, which stands at 25% of the electorate and is nearly 40% of new registrants.
–The increased Latino turnout seen in 2016, where Latinos accounted for 20% of the primary and 23% of the general election votes.
–The heightened political engagement due to the Trump administration’s focus on immigration, elimination of DACA and rhetoric about building a wall and increasing deportations.
–The extremely diverse ballot with leading candidates in 6 of the 9 statewide contests.
Public polling has been consistently showing dramatic Latino over-performance without much articulation of the rationale behind this bump.
But what shouldn’t be a subject of debate is the percentage of votes cast by Latinos in past gubernatorial primaries. That should be considered the starting point from which potential growth is considered.
As seen in the following chart, Latino registration has been growing at a consistent rate, but Latino turnout has not. It has followed a pattern of spiking in presidential elections, dropping precipitously in gubernatorial cycles. The average turnout for Latinos in the past four gubernatorial primary elections has been 11-12%.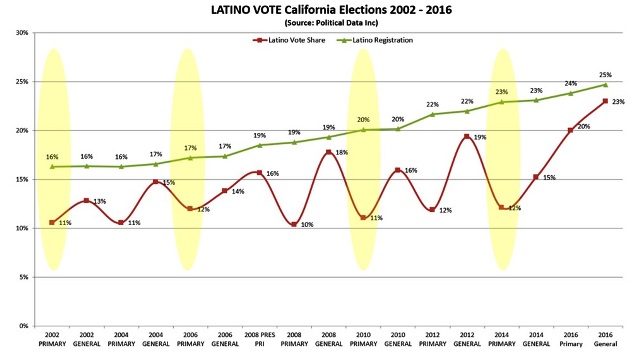
While Latinos have grown as a share of the voter file over the past 16 years, the gap between base registration and turnout has also grown. In 2002 and 2006 Latinos underperformed by 5-points, but in 2010 this grew to 9-points, and again in 2014 to 11-points.
However, public polling has been consistently showing dramatic Latino over-performance without much articulation of the rationale behind this bump.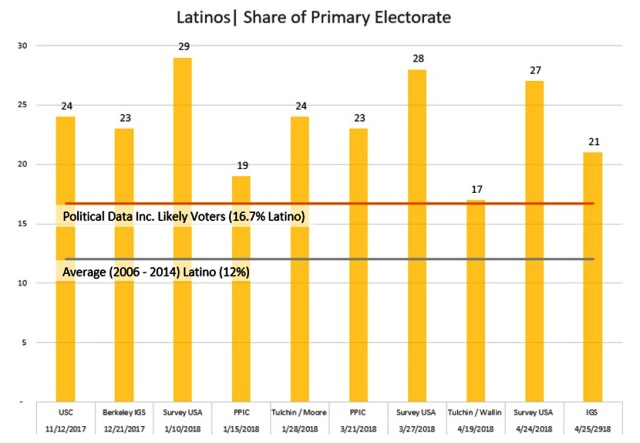
SurveyUSA’s Latino turnout projections have a history of being far off-base, and it is easy to see why. Despite the availability of Latino turnout data in California, SurveyUSA is the only pollster that uses data from the US Census Adult Citizen population to weight their polls. This might be effective in other states, not in California.
In 2016, SurveyUSA’s primary election polling had June and November election turnout pegged at 30% and 31% Latino, respectively, when actual Latino turnout was 10 points lower than that in the Primary, and 8-points lower than that in the General. And these faulty assumptions aren’t just at the statewide level. SurveyUSA has dozens of old polls on their website which show a dramatic miss-read of the eventual electorate, in one instance putting a likely voter universe in San Diego at 30% Latino, when the eventual Latino share of the electorate was just 11%.
In the last three gubernatorial primaries, 36% of voters were seniors.
If Latino turnout were to significantly spike, say to 18% of total votes cast, this would be a 50% increase over their 2014 performance. Given that this would likely occur in an election cycle with higher turnout from all groups, this 50% gain would likely require 75% more actual Latino votes cast than in the previous gubernatorial primary.
For Latino turnout to get to 24% Latino, which is the current average of the public polls, we would have to see an additional 800,000 Latino votes cast, with no commensurate increase in non-Latino voting. Turnout among Latinos would have to be stronger relative to all voters than turnout was in the current record high turnout of the 2016 General.
That’s not to say that Latino turnout won’t grow, for all the reasons cited earlier, but planting a flag on 28% of the voters being Latino doesn’t make it so. And it is the responsibility of a pollster making that kind of radical claim to have data to support it.
Seniors
Finally, the turnout by age group has been incredibly skewed young. In the past three gubernatorial primaries, 18-34 year olds accounted for just 7-8% of total votes cast. But in the surveys that report this metric, we see rates from 12-20% under 35.
Unfortunately, not all pollsters release the same age-ranges for younger voters. But they do provide the same over-65 calculations, and her we can see the other end of this age problem.
In the last three gubernatorial primaries, 36% of voters were seniors. The highest, in 2104, was at 43% age 65 or greater. However, the average of the public polls are only 28% seniors.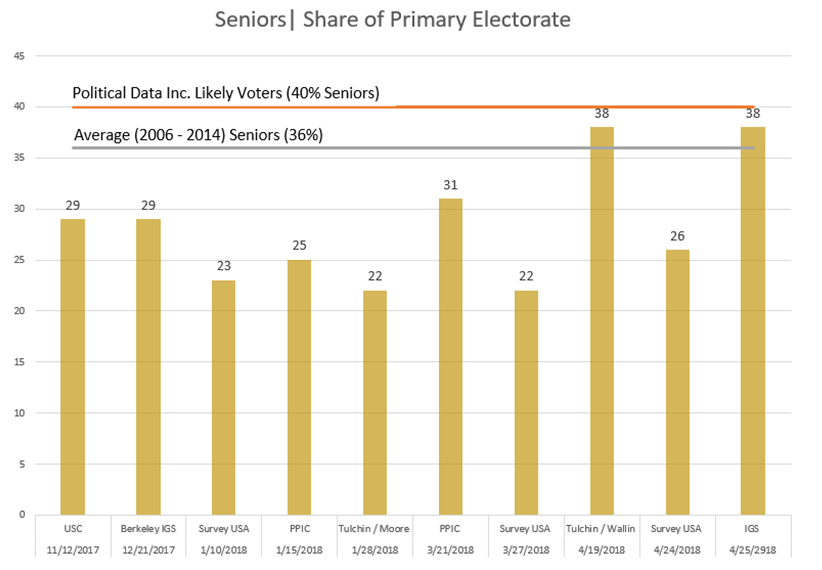
What does all this mean?
For starters, journalists, campaigns, and other political observers should be looking at these metrics before even peeking at the results of a poll.
If a pollster is putting out a view of likely voters that is incredibly skewed – particularlywhen it is based on metrics that align to vote choices like age, ethnicity and party – then that should colorhow the results are viewed.
We will see several more of these public polls in the coming months, and one would hope that they each do their best to plan for what is a likely June electorate.
We don’t need all polls to herd their weighting to the exact same set of past vote history, but insofar as they differ from the past they should be able to articulate why they are expecting a different electorate.
—
Ed’s Note: Includes disclosure information, 23rd graf. Paul Mitchell, a regular contributor to Capitol Weekly, is the creator of the CA120 column, vice president of Political Data and owner of Redistricting Partners, a political strategy firm.
Want to see more stories like this? Sign up for The Roundup, the free daily newsletter about California politics from the editors of Capitol Weekly. Stay up to date on the news you need to know.
Sign up below, then look for a confirmation email in your inbox.
As a political and demographic researcher I have found the voter file and voter history quite fascinating in analyzing election results down to the precinct level. In some states like VA where I now live the voter file is very difficult to access. It costs thousands of dollars to obtain it and you have to be approved by the state to fit in to several categories to qualify to buy it. In FL where I am from the opposite is true. You can get the voter file and voter history for nothing if you promise not to use it for commercial purposes,
Where does CA stand on this voter file transparency scale? I have read that you can obtain the state voter file for $30. But I could not find any information on CA election site on how to order this.
Nails it, as usual.
This is the best explanation of why polls are all over the map that I’ve seen.